December corn futures closed this afternoon at $3.77 ¼, finishing down 9 ¾-cents week-on-week. It was a very disappointing week for Corn Bulls and one I noted was likely in my commentary a week ago. Corn futures (CZ5) failed to manufacture closes over both the 50 and 100-day moving averages early in the week, and rolled over shortly thereafter. Is corn’s ongoing inability to sustain rallies solely a function of the looming corn harvest and this’s near record corn yield, or is there more to it?
I believe strongly the elephant in the room for most Corn Bulls prohibiting sustainable future corn rallies isn’t so much the “threat” of continued record to near record corn yields, but rather the lack of a verifiable demand increase in any one particular sector.
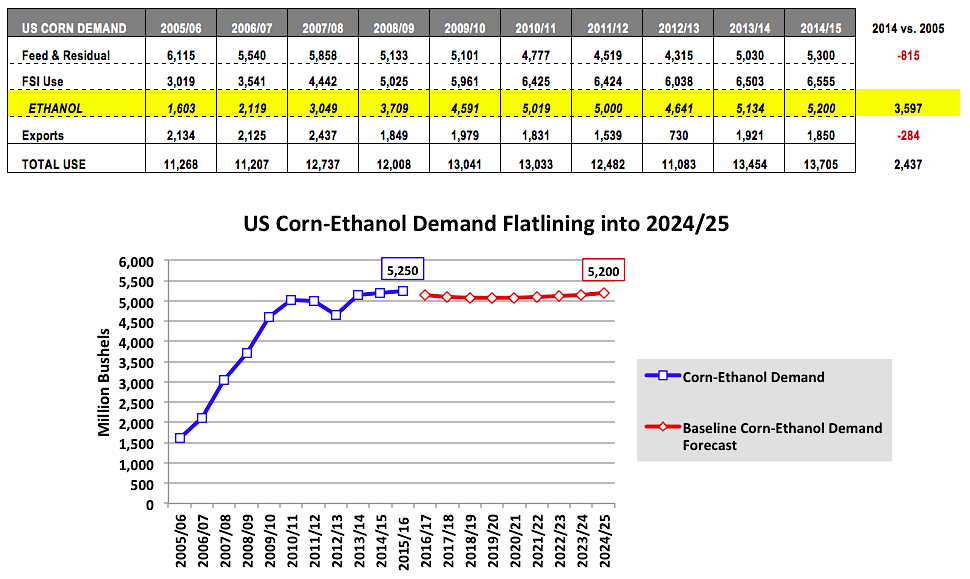
Currently, as of the September 2015 WASDE report, US corn-ethanol demand was forecasted to account for 38.2% of total US Corn demand in 2015/16, feed and residual use 38.3%, and exports 13.4%. However of those 3 primary usage sectors only corn-ethanol demand has grown over the past 10-years. From 2005/06 through 2014/15, US corn-ethanol demand alone accounted for a 3,597 million bushel increase to total US Corn demand. Over that same time period US corn exports and feed & residual use declined by a combined -1,099 million bushels.
Therefore were it not for the aggressive expansion of the US ethanol industry from 2005 through 2014, US Corn demand would in likelihood be much closer to the 11,268 million bushels recorded in 2005/06 versus the 13,705 million bushels just consumed in 2014/15.
That said the once explosive growth in US ethanol production capacity has essentially stalled in recent years due in large part to the well-publicized E10 Blend Wall. This has become the undeniable problem for the Corn Bulls. In fact since 2010 US corn-ethanol demand has only grown by 181 million bushels as of the end of the 2014/15 marketing year (which just concluded on August 31st, 2015). Furthermore in the USDA’s baseline S&D report titled “Agricultural Projections to 2024” released in February of 2015, the USDA forecasted US corn-ethanol demand of 5,200 million bushels in 2024/25, which if realized would be 50 million bushels LESS that the USDA’s current estimate for 2015/16. Therefore what the USDA is essentially saying is that they are anticipating NO growth for US corn-ethanol demand over the next 9 years.
The E10 Blend Wall virtually eliminates the need for future growth of the US ethanol industry based on recent gasoline usage data.
- ETHANOL DEMAND: During the 2014/15 crop year (September 1st, 2014 – August 31st, 2015) weekly US gasoline demand averaged 9,100 MMbpd (highest in the past 5-years), which equated to total crop year gasoline demand of approximately 140 billion gallons and by inference E10 demand of up to 14.0 billion gallons. Since 2010, the largest crop year ethanol export total has been 1.1 billion gallons (2011/12). Therefore if we apply the largest E10 demand base and export total from the last 5-crop years, total US ethanol demand could theoretically approach 15.1 billion gallons over a 12-month period.
- ETHANOL SUPPLY: In 2014/15, US ethanol production averaged 956,500 barrels per day (the highest ever on record for a crop year), which equated to total ethanol production of approximately 14.7 billion gallons. However it should be noted that on the week ending June 19th, 2015, weekly ethanol production averaged 994,000 bpd, which if sustained over the course of an entire crop year would equate to total ethanol production of 15.25 billion gallons. Point being, the US ethanol industry already has the production capacity in place to meet the highest theoretical ethanol demand base (15.25 billion gallons of production versus total demand of 15.1 billion gallons).
- CORN-ETHANOL DEMAND IMPACT: Applying an industry standard ethanol yield of 2.82 gallons produced per bushel corn ground over 15.1 billion gallons of ethanol equates to 5,355 million bushels of corn-ethanol use versus the USDA’s current 2015/16 forecast of 5,250 million. Therefore US corn-ethanol demand could increase slightly over time but likely not enough to warrant a significant market premium or substantially higher price floor in corn futures. This is a MAJOR demand shift versus the past 10-years and one that will directly affect US corn producer profitability.
What will it take to increase ethanol demand beyond the aforementioned 15.1 billion gallons?
- Additional increases in US gasoline demand, which are unlikely over time due to higher fuel economy standards.
- A move to higher ethanol blends exceeding 10% (i.e. E15); however this too has its well-documented challenges both politically and from an infrastructure perspective. Furthermore E85 expansion is a much tougher sale with crude oil under $50 to $60 per barrel. The current E85 market is much too small to have a significant impact on demand.
- Additional US ethanol exports; this is a real possibility; however export development overseas takes time. The reality is the US’s current export market share only accounts for approximately 6% of total US ethanol demand.
What then are the potential short and long-term impacts of sideways to lower US corn-ethanol demand THROUGH 2024?
- One of the most alarming trends I believe will be a downward shift in planted corn acreage…over time. In 2005/06 US planted corn acreage totaled 81.8 million acres. By 2012/13 US planted corn acreage had grown to an incredible 97.3 million planted acres, which was the largest US corn acreage base since 1936. I’m not attributing the entire acreage increase to the rapid expansion of the US ethanol industry; however it certainly played a significant part in it. Higher US corn demand, increased managed money participation, and the drought in 2012 fostered in a period of record setting corn futures highs in 2008, 2011, and 2012 with futures values exceeding $7.00 and $8.00 per bushel. The higher prices afforded seeding more corn acres, as well as, maximizing input costs in attempt to optimize corn yields. It all paid off…until now. If the forward curve in corn-ethanol demand is indeed sideways to lower and US corn yields continue to improve, the reality is 90+ million corn acres are no longer necessary. We’re already seeing this with this year’s planted corn acreage base falling to 88.9 million, the lowest since 2010/11.
- Without a legitimate demand story, one that shows the possibility of corn use growing sustainable over the next several years, the corn market is once again likely going to be relegated to supply side rallies (for corn futures). Consider the following:
continue reading considerations for corn futures prices and prospects…

 Trading Near Top Of Price Range")


