Stock market caution signals are beginning to show up and active investors should take note.
I am seeing some severe breaks of the bearish wedge patterns I highlighted recently.
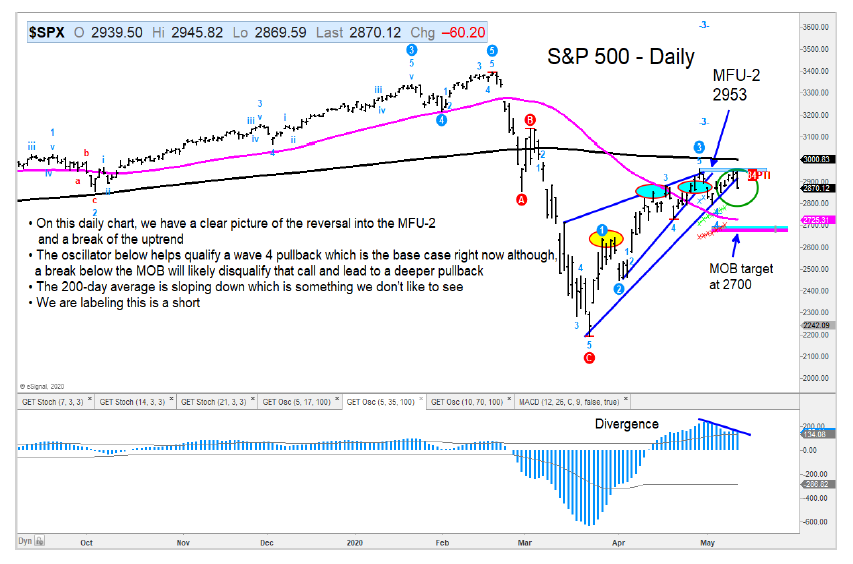
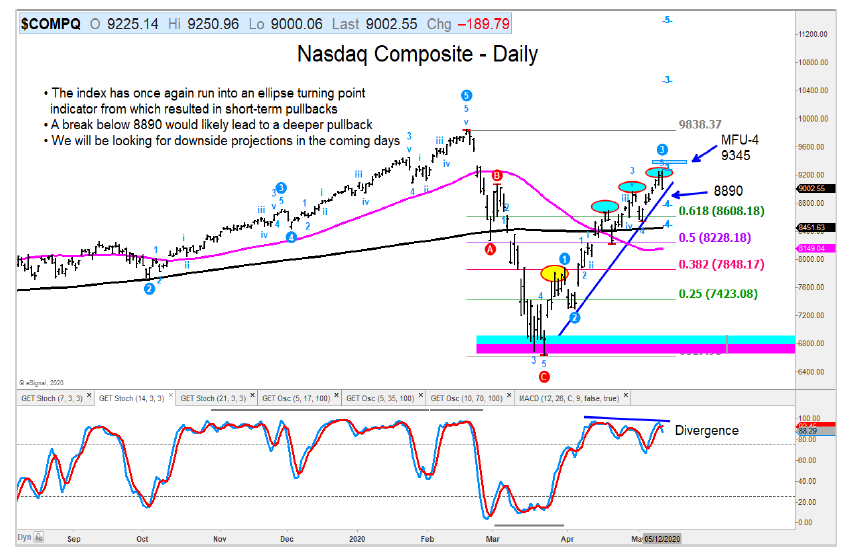
I would be out of (ie. sell, hedge, or short) all but the Nasdaq Composite which needs a bit more of a break lower to confirm its pullback.
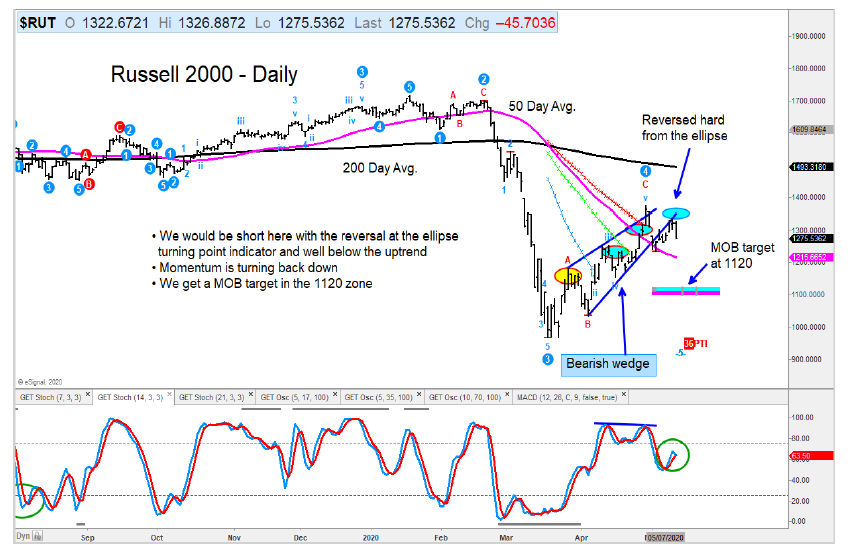
I think the best short candidates for traders are the Russell 2000 Index (RUT) and the Mid-Caps (MDY).
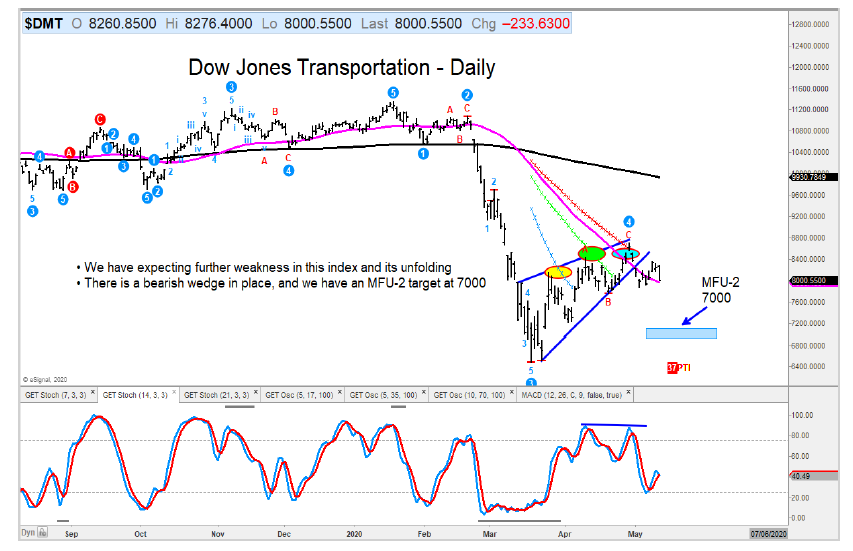
Below are 5 “daily” charts, highlighting short-term trading outlooks.
The are the S&P 500 Index, Nasdaq Composite, Russell 2000 Index, Mid-Caps, and Dow Jones Transportation Average.

The author may have position in mentioned securities at the time of publication. Any opinions expressed herein are solely those of the author, and do not in any way represent the views or opinions of any other person or entity.


: Creating Bullish Divergence?")


