The daily charts in many of the stock market indices I review have negative wedge patterns in place.
I expect this will lead to some near-term weakness.
The Dow Transports and Utilities are in a weak position and we expect more weakness in the days to come there.
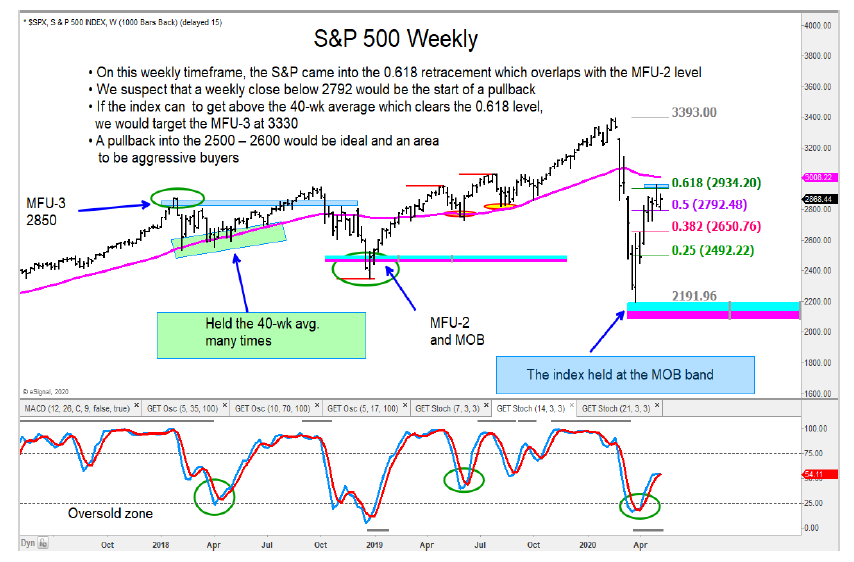
The S&P 500 tagged the 0.618 Fibonacci price retracement and an MFU-2 target area with last weeks high. The wedge pattern on the daily timeframes has us concerned “short-term”.
I see the same setup for the Russell 2000, Mid-Cap (MDY), and Dow Transports.
The Dow Utilities had a hard break below 787, which we pointed out last week. There is a negative MFU downside target in place, so I am a net seller.
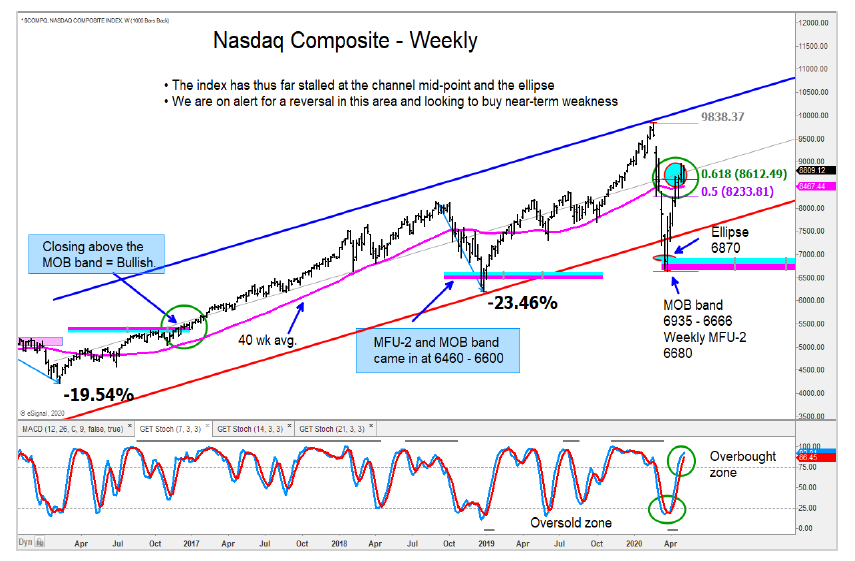
I believe the MOB bands which held many of these stock market indices have marked the lows and don’t expect a full retracement back down to the March lows. My expectation is we see near-term weakness that will ultimately provide a good buying opportunity.
The author may have position in mentioned securities at the time of publication. Any opinions expressed herein are solely those of the author, and do not in any way represent the views or opinions of any other person or entity.


