The Baird “Weight of the Evidence” approach has been a reliable indicator of overall trends in the stock market and encompasses six key influences on the markets – interest rates, the economy, valuations, investor sentiment (flow of funds), seasonal patterns, and breadth (underlying strength of the broad market or The Tape).
This indicator has been “neutral” for the past two months.
During that period of time the stock market has seen extreme bouts of volatility.
However, with the exception of the outperformance of a handful of big tech stocks and a few healthcare stocks, the market has basically traded sideways and gone nowhere.
Here are some key considerations:
1 – The Federal Reserve’s move to cut interest rates to zero as well as extraordinary amounts of liquidity injected into our financial system has helped stabilize the debt and equity markets during the COVID-19 upheaval.
2 – The unrelenting string of devastating economic data including massive unemployment numbers, lowest industrial production numbers, awful retail sales number, etc., point to a slower economic recovery.
3 – Valuations – The recent rally in the market has driven up stock market valuations. The ratio of prices to expected annual earnings has risen to 22 times for the S&P 500, far ahead of 15.4 times for the 20-year average.
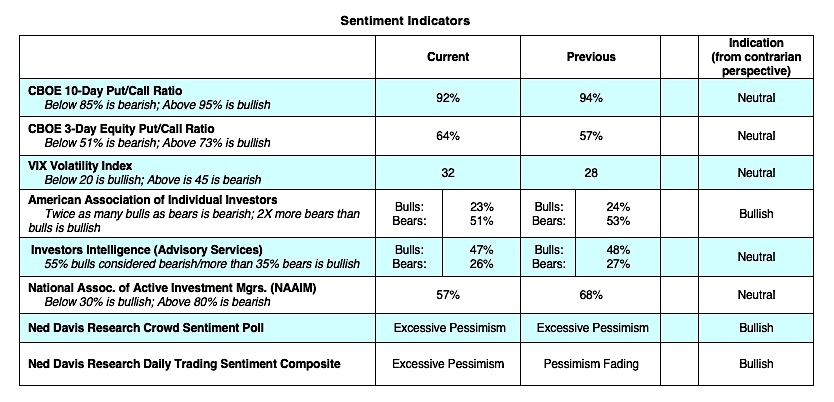
4 – Investor Sentiment is mixed – Investors Intelligence (II), which tracks the mood of Wall Street letter writers, shows an increase in the bullish camp for the fourth straight week. From a contrary opinion stance that is bearish. The Chicago Board of Options Exchange (CBOE) reports a sharp drop in demand for puts, a sign that investors are not expecting a drop in stock prices – a bearish signal.
American Association of Individual Investors (AAII) shows more than twice as many bears than bulls, a bullish sign. Additionally, money market funds showed a record spike in March suggesting the individual investor is cautious – a bullish signal.
5 – Seasonal Patterns – Although markets are generally apolitical, during a presidential election year the historical record shows that equity markets do best when the incumbent wins the presidency.
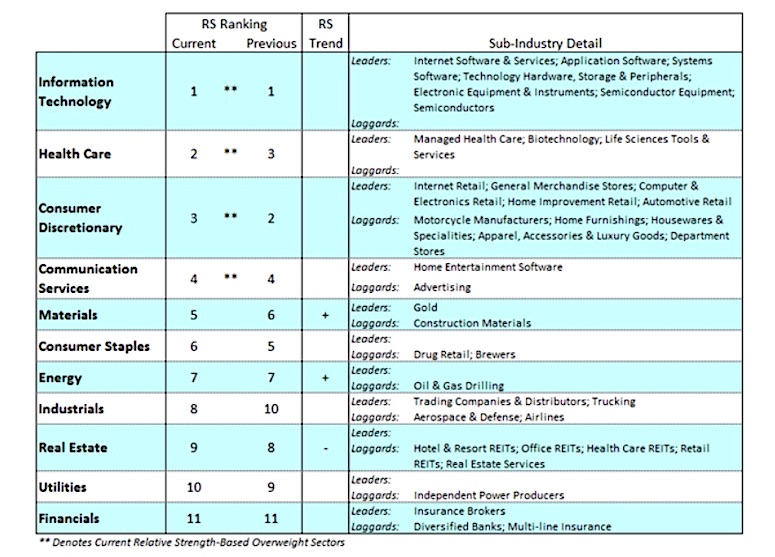
6 – The Tape – The rally off the March lows was supported by a small number of technology-related stocks while the broad market, as measured by the Russell 2000 and the Value Line Index, has lagged. Despite the recent strength, only 22% of the industry groups within the S&P 500 Index are in defined uptrends. Additionally, only 26% of the S&P stocks are trading above their 200-day moving average. We need to see a broad-based rally to confirm that the stock market is in gear for a sustainable advance.
The Bottom Line – There is a slight bias to the bearish case when taking all indicators into consideration, BUT with the overwhelming injection of monetary and fiscal stimulus and the promise of more to come, we continue to rate the weight of the evidence as neutral. We don’t have a “virus indicator” which would be the most valuable indicator of all but we will all have a clearer picture of possible treatments, vaccines and consumer behavior as the economy continues to open in the coming weeks.
Twitter: @WillieDelwiche
Any opinions expressed herein are solely those of the author, and do not in any way represent the views or opinions of any other person or entity.

: Cup (and Maybe Handle) Watch")
 Trading Near Top Of Price Range")

