Crude oil prices raced higher from late October to early March this year.
After a multi-week move lower, traders wondered if the crude oil rally was over. That may not be the case.
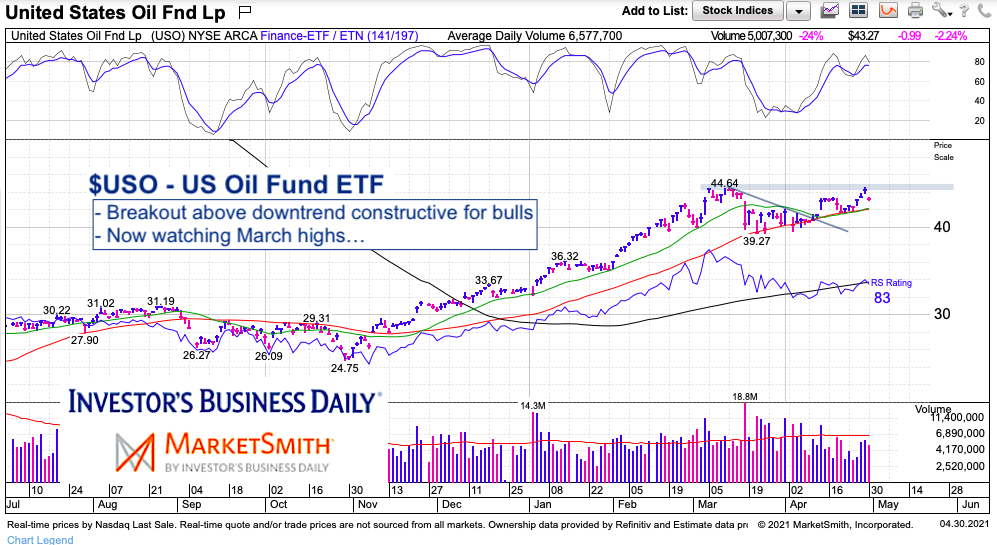
Oil prices have come back to life in April, however, and may be eyeing another move to new highs as we enter May. Today’s chart offers a macro glimpse at the United States Oil Fund ETF (USO).
Note that the following MarketSmith charts are built with Investors Business Daily’s product suite.
I am an Investors Business Daily (IBD) partner and promote the use of their products. The entire platform offers a good mix of technical and fundamental data and education.
$USO United States Oil Fund Chart
As you can see, USO broke out above its down trend line a couple weeks ago (bullish). This action was constructive and offered a short-term trading buy signal. Momentum is elevated and holding. RS is also still strong. We now wait to see if this Oil ETF can breakout above the March high. If so, then USO may be headed to $47.96 (the 1.618 Fib). Stay tuned.
Twitter: @andrewnyquist
The author may have a position in mentioned securities at the time of publication. Any opinions expressed herein are solely those of the author, and do not in any way represent the views or opinions of any other person or entity.


