After a bounce back week, we look at the current lay of land across the financial markets, with a focus on the major U.S. stock market indices and indicators.
Key Stock Market Takeaways (macro):
1). The S&P 500 Index (INDEXSP: .INX) bounce is being accompanied by evidence of improved rally participation.
2). Longer-term breadth trends remain a challenge at home and abroad. Sentiment becoming more supportive of stocks.
3). Neither Broker/Dealer Index nor copper prices have joined bond yields in making new lows.
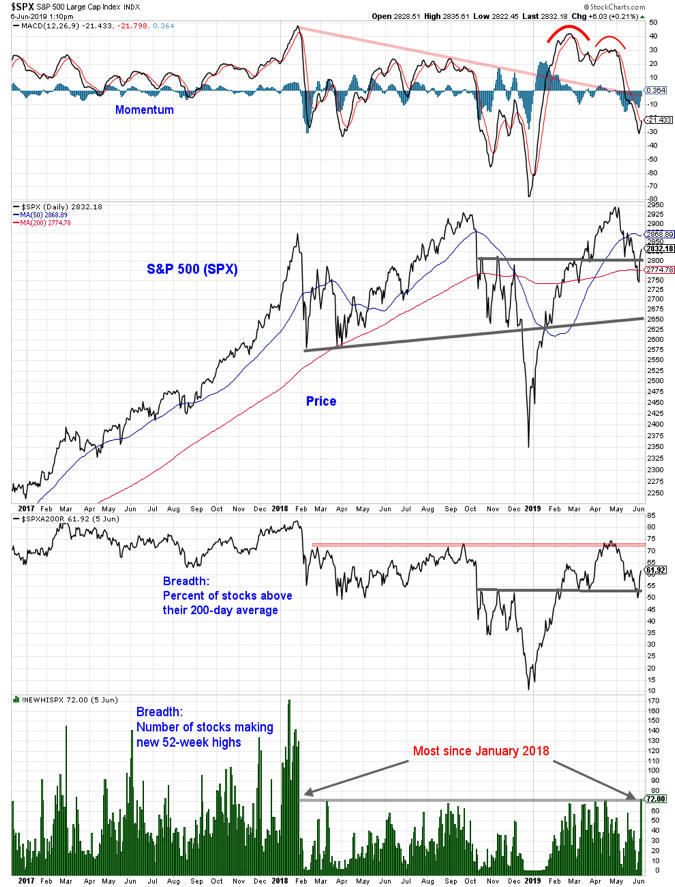
After four consecutive weeks of decline (and a nearly 200 point drop), some were suggesting that the S&P 500 was due for a bounce. That emerged this week. A few days of rallying is likely not sufficient to undo the deterioration in price and momentum trends seen over the past month. As strong as Tuesday’s 2% rally on the S&P 500 was, it failed to produce a 9-to-1 upside/downside volume day on the NYSE (which would have been an important offset to the 9-to-1 down day seen in May).
There have though been indications of improving rally participation. The percentage of stocks in the S&P 500 that are trading above their 200-day average has surged from 50% to 62%. After a steady advance in the number of stocks making new 52-week lows in May, this week saw the highest single-day number of stocks making new 52-week highs since January 2018. While encouraging, these breadth gains may be more a product of the unusually noisy market environment than evidence of an underlying change in character. Evidence of further breadth gains may be necessary to arrive at that conclusion.
While short-term breadth improvements for the S&P 500 are welcome, the noise of the current environment calls for looking for confirmation elsewhere. While 62% of S&P 500 stocks are above their 200-day averages, only 38% of NASDAQ stocks can claim the same. The NASDAQ has seen more stocks making new lows than new highs every day for the past three weeks. As mentioned in last week’s Market Commentary, global market remains poor: the percentage of world markets with rising 200-day averages remains below 50% and has stopped improving.
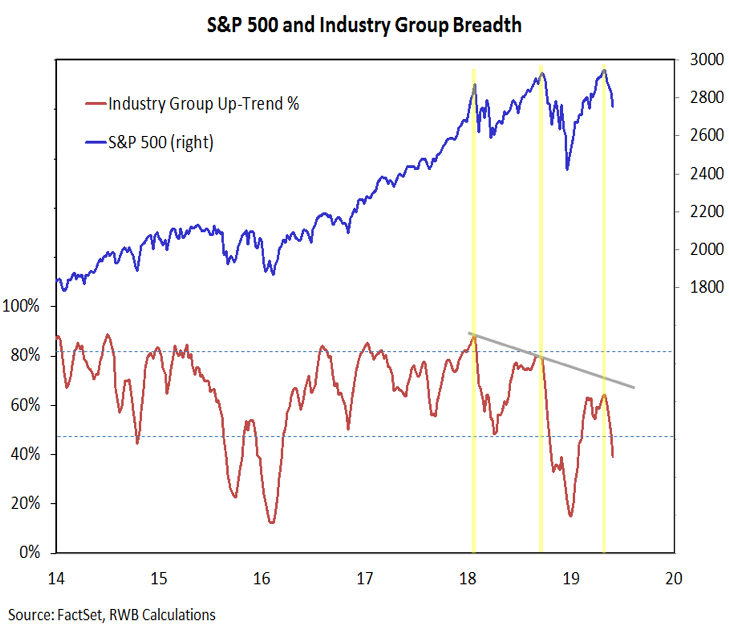
Our industry group trend indicator experienced a significant deterioration over the course of May, and a preliminary look at this week’s data (not included in the chart) suggests little, if any, improvement. The longer-term breadth backdrop is mixed at best.
The mixed breadth backdrop is complemented by a mixed sentiment backdrop. One survey (II) makes the case that optimism is entrenched and pessimism has hardly budged while another (AAII) suggests that over the past month bulls have plummeted and bears have soared to levels not seen since December Options data shows a similar bifurcation: soaring put/call ratios suggested a rising level of fear, while the VIX showed little evidence of fear.
Composite sentiment measures can help clarify the situation. The short-term NDR trading sentiment composite has approached its December lows, while the NDR Crowd Sentiment Poll has just reached the pessimism zone. The best mode for stocks is after a pessimism extreme has been reached and investors are turning more optimistic.
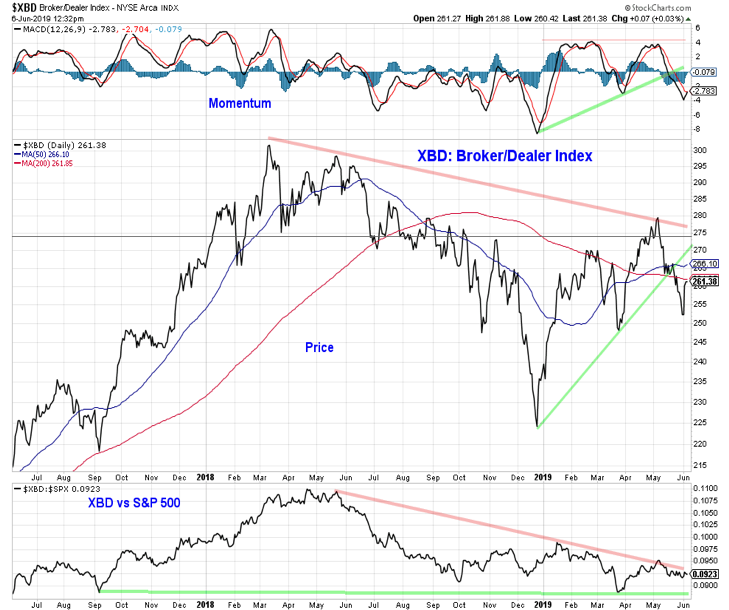
Much is being made of the recent drop in bond yields and expectations for rate cuts by the Fed (we discussed this in our Macro Updatethis week). Two areas of the market that are not confirming the decline in bond yields are the Broker/Dealer index and copper prices. While neither is a particular source of strength right now, they also not showing the degree of weakness/concern being expressed by bonds.
The Broker Dealer index has held above its March lows on both an absolute basis and relative to the S&P 500. The Financials sector overall has held up well and is seeing improving conditions in our sector relative strength rankings.
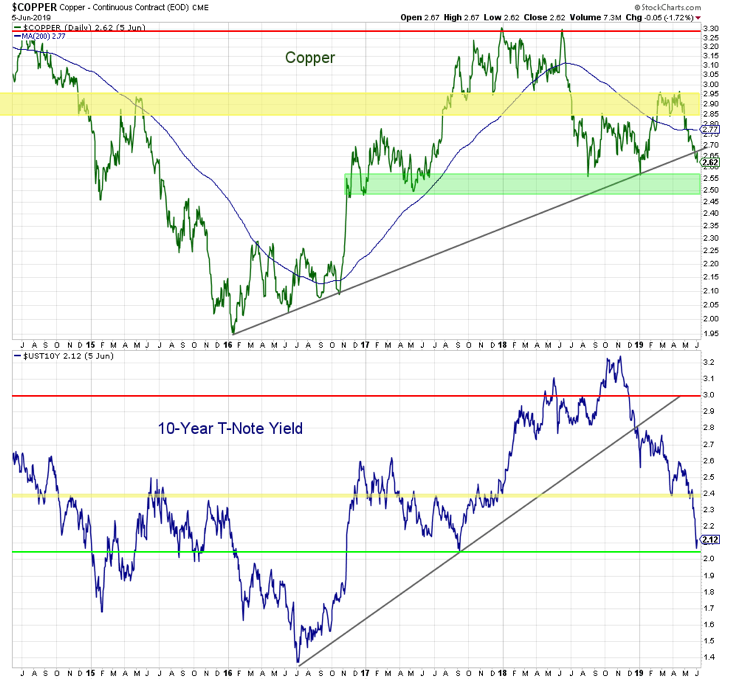
While the yield on the 10-year T-Note has dropped to its lowest level since 2017, the price of copper is holding above the lows marked out in the second half of 2018. As with the Broker/Dealer index, this is not about claiming strength (copper is more than 10% off its April high and is struggling to find support at the trend-line off of its 2016 lows), but identifying less-than-expected weakness. It also highlights divergences between areas that at times move together.
The lack of confirmation from copper and improving relative strength from broker/dealers could be an indication that the bond market has over-reacted to trade tensions and their potential effect on the economy. If that is the case, the next move by yields may be to the upside.
Twitter: @WillieDelwiche
Any opinions expressed herein are solely those of the author, and do not in any way represent the views or opinions of any other person or entity.


 Rolling Over At Key Fibonacci Level?")
