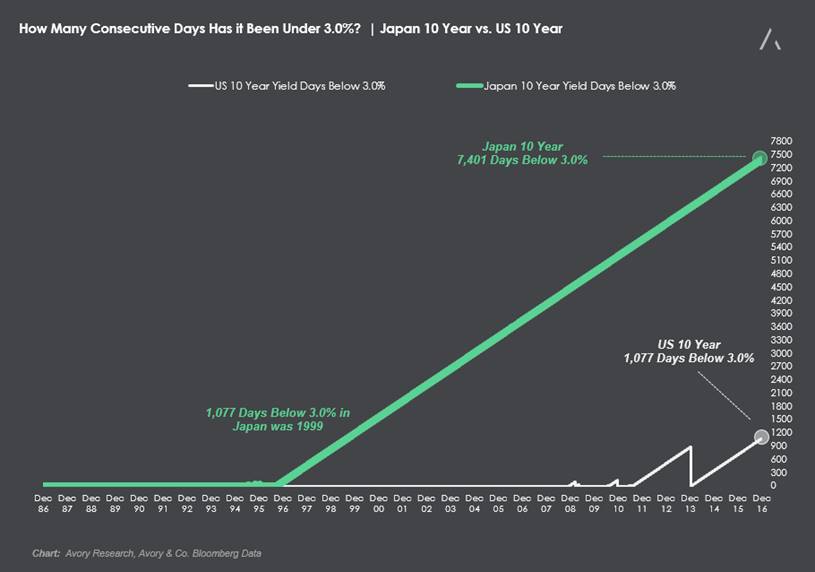
The US 10 year treasury yield (INDEXCBOE:TNX) has been moving sharply higher as of late and getting a great deal of attention from both equity and fixed income investors. Notwithstanding this backup in yields, the 10 year yield is still below 3%, and this has been the case for 1,077 consecutive days.
Low rates in the U.S. have many likening the situation to Japan and an economy that’s been in a drought for years. After pulling some data it’s clear that it is not the same situation. However, there are some interesting similarities and differences to point out.
Let’s look at Japan as an example of just how long a country (and economy) can experience low rates. Japan has seen its 10 year yield below 3% since 1996-1997, or 7,401 consecutive days.
Now there are some big differences between Japan and the US, but there are also some economic forces which are similar.
US / Japan Economic Similarities & Differences
The similarities:
- Real GDP has been moderate to low.
- Inflation has been meager.
- Median age of each population is high.
- Debt has increased dramatically.
The differences:
Those are the basic similarities, now what are the differences? The broad difference is that in Japan, each of the indicators listed above are just much worse.
Real GDP
- US GDP: Real GDP in the US has averaged 4.3% since 1996, and 3.8% since September 2010.
- Japan GDP: Real GDP in Japan has averaged .8% since 1996, and 1.1% since September 2010.
Inflation (CPI)
- US Inflation (CPI): US inflation has averaged 2.2% since 1996, and only 1.6% since September 2010.
- Japan Inflation (CPI): Inflation in Japan has averaged .1% since 1996, and .5% since September 2010.
Median Age of Population
- US: ~38
- Japan: ~46
- World Average: ~28
Debt to GDP
- US: ~104
- Japan: ~229
- Developed Average ex Japan: ~92
Looking at those figures, it is easy to understand why Japan has held interest rates low for so long. No growth, no inflation, increasing debt burden, and an aging population. So when judging whether interest rates are going to stay low, think about what has driven Japan’s low rate environment and judge those US components individually. Will rates be below 3 or 4% for 7,000 days? It will depend on the factors listed above and many others.
You can catch more of my market insights on my site, the Market Meter. Thanks for reading.
Twitter: @_SeanDavid
Any opinions expressed herein are solely those of the author, and do not in any way represent the views or opinions of any other person or entity.


: Showing Some Signs of Emerging Strength")
