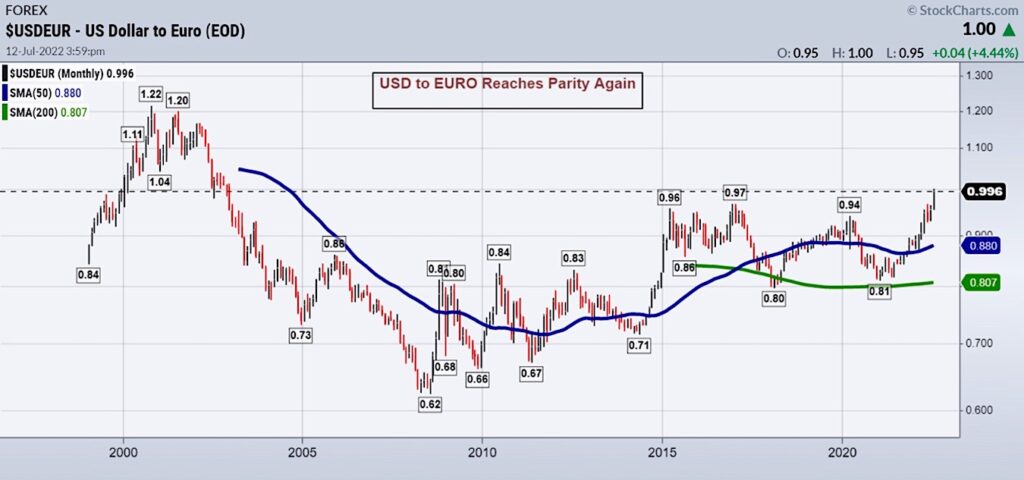
US Dollar and Euro at Parity Again
Investors are flocking to the dollar as Europe braces for a potential energy crisis in the Fall. The euro has been under pressure recently, with investors pulling their money out in favor of the haven currency—the US Dollar.
This is the first time the dollar and euro are at parity since 2002.
Can it last?
The interest rate differential between the US and Europe, bond yields, and global risk-off sentiment have had a major impact on the currency values and currency pair.
The European Union is currently facing many challenges, including an ongoing war near its borders between Russia and Ukraine and a growing risk of recession as well.
The EURO has been steadily declining over recent months and was finally pushed down to one US Dollar this week.
The Federal Reserve’s plan to continue to hike aggressively has caused the US dollar to rise against most major foreign currencies like euros and Japanese yen.
Yet, investors often sell dollars when the U.S. economy goes into a downturn.
Is the U.S. Dollar reaching its peak?
The global economy is in a downward spiral, with central banks around the world doing everything they can to tighten monetarily and maintain price stability.
The United States has committed to bringing down inflation through higher interest rates.
Although one can see why the Federal Reserve would seek to take this tact, it also creates a greater risk for recession.
If recession fears cause the dollar to peak, then we are back to looking at higher inflation if the dollar weakens.
The Charts
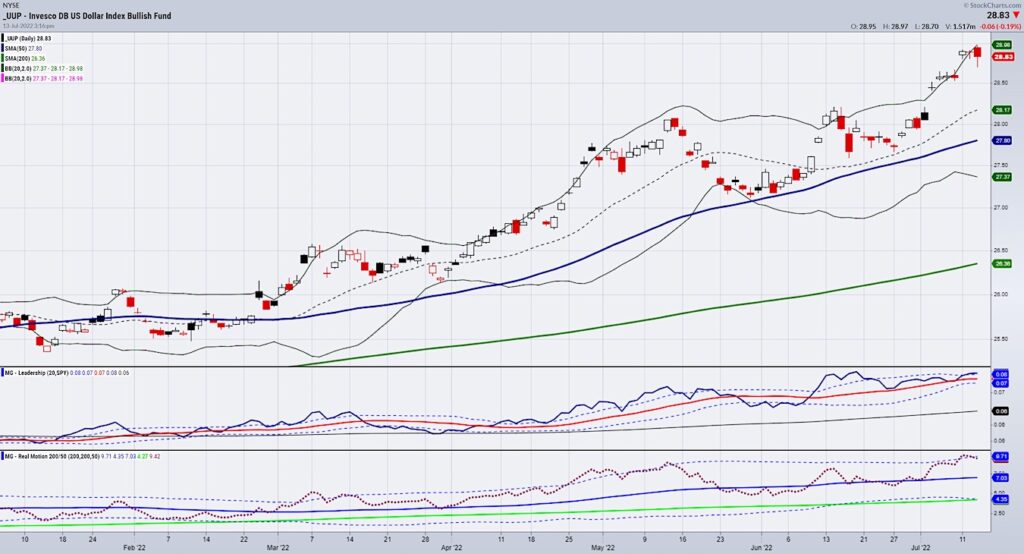
The dollar as seen through the ETF UUP illustrates the potential for a peak in value.
First, our Real Motion indicator shows a mean reversion (when the red dots fail the dotted Bollinger band).
Secondly, the price is also failing the solid line Bollinger band, another indication of a mean reversion setup.
If you are a candlestick fan, then notice that the body of the most recent candle (July 13th) after the CPI report, also shows a bearish engulfing pattern (body of candle is bigger than the bodies of the last 2 candles.)
Put that all together and we should know very soon whether the dollar takes a rest and leaves the door open to higher commodity prices regardless of the Fed’s best intentions to curb inflation.
Mish in the Media
StockchartsTV-July Calendar ranges
CMC Markets-Weekly Update
Stock Market ETFs Trading Analysis & Summary:
S&P 500 (SPY) 372-386 new trading range to watch
Russell 2000 (IWM) 170 support must hold
Dow Jones Industrials (DIA) 307 support and needs to clear 315
Nasdaq (QQQ) Looking heavy unless it clears 297 and 277 key support
KRE (Regional Banks) 56 the 200 WMA 60 resistance
SMH (Semiconductors) 200 now interim support 210 resistance
IYT (Transportation) What was hopeful now not looking good, under 112 or the 200-WMA
IBB (Biotechnology) 129.50 resistance 117 support
XRT (Retail) 60.75 the 200-WMA 57.50 support
Twitter: @marketminute
The author may have a position in mentioned securities at the time of publication. Any opinions expressed herein are solely those of the author and do not represent the views or opinions of any other person or entity.


")
