The 2 year rally in the US Dollar Index pushed it up over 109 this month before heading lower.
The action this month has also coincided with another big rate hike by the Federal Reserve.
BUT there may be something bigger in play: Triple Resistance.
As Joe Friday says, “The facts, Ma’am. Just the facts.”
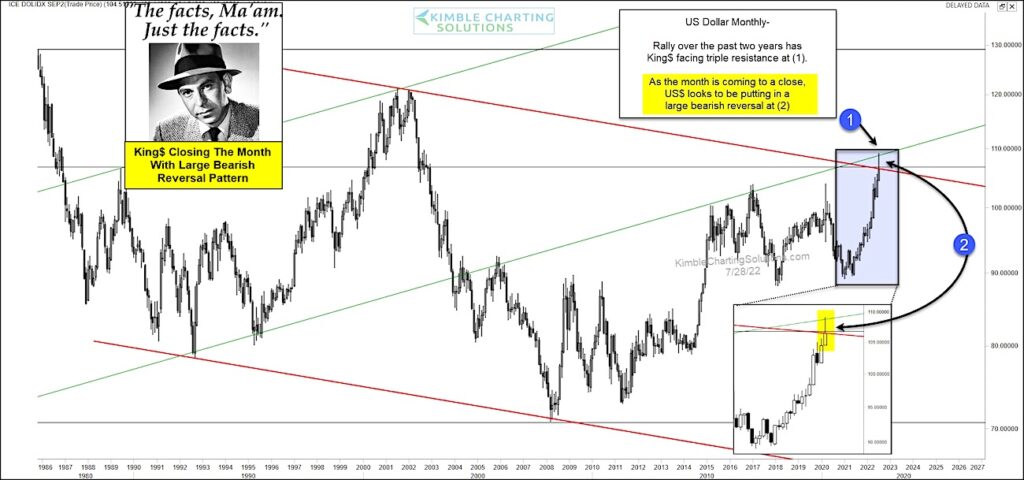
In today’s long-term “monthly” chart of the US Dollar Index, we can see the long wick on this months chart as price reversed lower from (1). See the full reversal candle highlighted at (2).
But the simple, yet very important, reason why King Dollar may be reversing course is a confluence of triple resistance.
Price reversed from overhead rising trend resistance and declined back below lateral resistance as well as falling trend line resistance. If King Dollar cannot recover these levels on a monthly closing basis, it will signal further weakness ahead.
Will it all start with this month’s large bearish reversal? Stay tuned!
US Dollar Index “monthly” Chart
Note that KimbleCharting is offering a 2 week Free trial to See It Market readers. Just send me an email to services@kimblechartingsolutions.com for details to get set up.
Twitter: @KimbleCharting
Any opinions expressed herein are solely those of the author, and do not in any way represent the views or opinions of any other person or entity.

: Worrisome to Broader Market?")
