Several weeks back, we highlighted why the US Dollar might be due for a rally… and how this could slow the rise in precious metals prices.
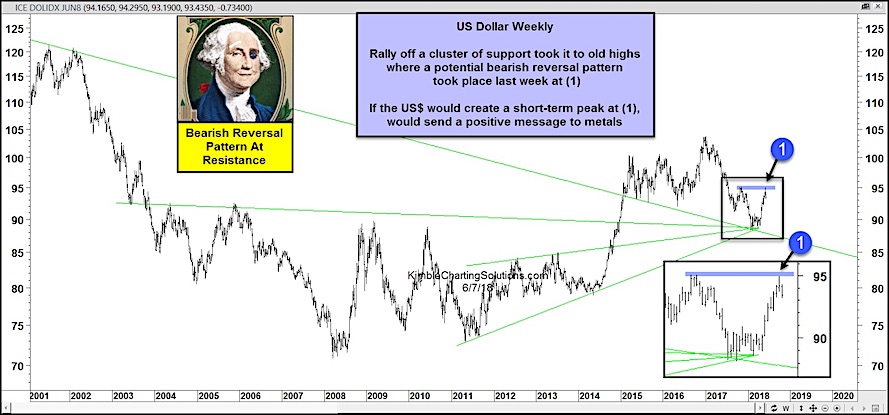
The greenback was deeply oversold and testing a confluence of price support.
That support can be seen on today’s updated chart as well (see green lines).
Sure enough, the Dollar put together a multi-week bounce that carried it up to the November 2017 highs before stalling out last week. That rally coincided with a pullback in precious metals prices.
Bearish Reversal Pattern?
The November 2017 highs proved to be stiff resistance for the buck – the Dollar literally stopped on a dime and reversed lower. Will this reversal mark another important “turn”?
If the US Dollar creates a short-term peak at point (1), it would send a positive message to precious metals. Stay tuned!
US Dollar “Weekly” Chart
Note that KimbleCharting is offering a 30 day Free trial to See It Market readers. Just send me an email to services@kimblechartingsolutions.com for details to get set up.
Twitter: @KimbleCharting
Any opinions expressed herein are solely those of the author, and do not in any way represent the views or opinions of any other person or entity.

: Showing Some Signs of Emerging Strength")
