CZ5 closed back under the 100-day moving average, which had been a recent area of strong underlying price support. To sustain any hope of a recovery back to $4.00 in the next 2 to 3-weeks, December corn futures will now need to hold both the 35 and 50-day moving averages, which are both currently resting at $3.81. The 5 and 10-year price seasonals still support sideways to slightly higher price action through last half October.
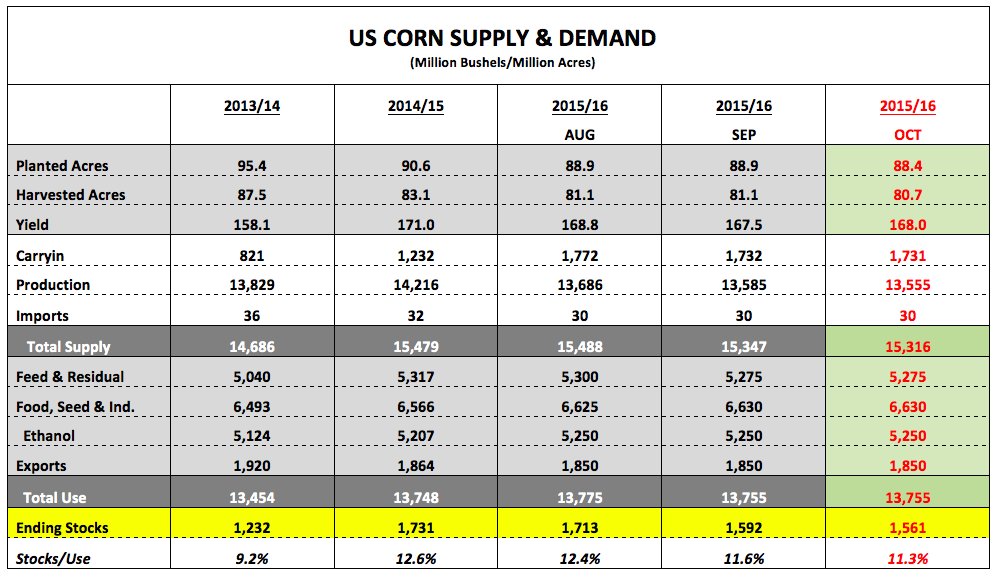
That said, prior to the release of the report I had assumed $4.25 CZ5 was again possible; however that was predicated on a 1 to 2 bpa yield decline on Friday. Had this occurred this would have ignited a conversation regarding the possibility of another corn yield decrease in the November Crop report. Such supportive speculation has now lost all momentum with the yield increasing in the October Crop report. As a result significant rallies should prove difficult to sustain over the short-term.
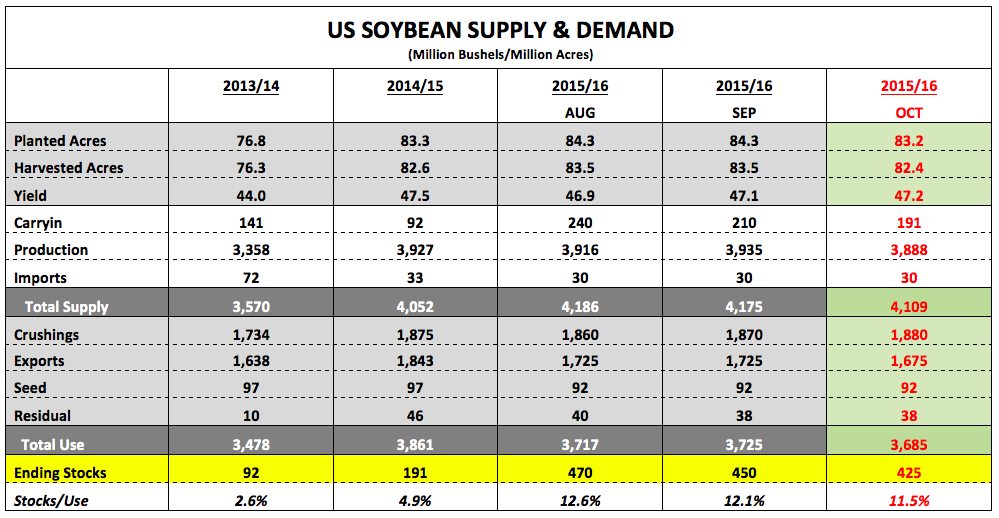
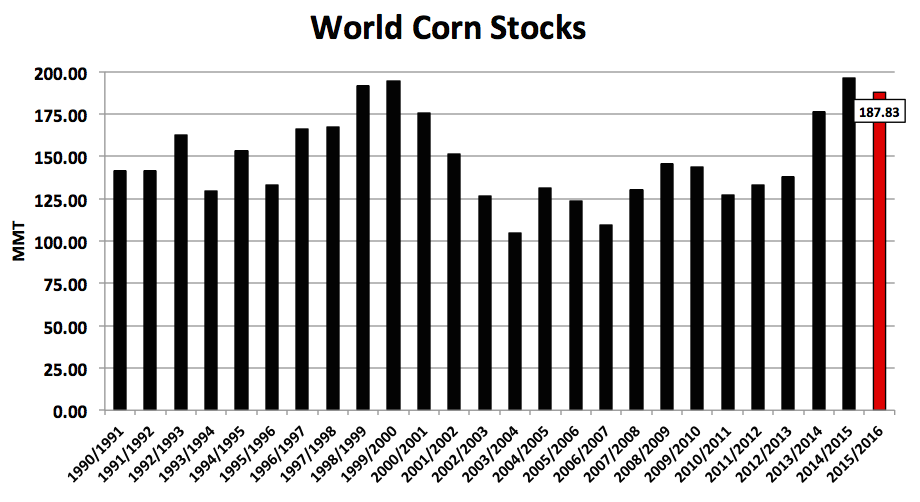
November Soybeans Futures: November soybeans got an initial lift on Friday following the unexpected planted acreage decline of 1.1 million acres that had Soybean Bulls cheering. However by the close that euphoria, which led momentarily to SX5 trading up by more than 15-cents per bushels on the day, had largely dissipated. The realities of a 425 million bushel US carryout, which is still 234 million higher than a year ago, along with record 2015/16 World soybean stocks came back into clear view.
I do think there’s the ability to make the case that soybean futures probably don’t have sizable downside risk back under $8.60 SX5 (lowest level since 2009); however I also don’t see a major reason to get long at or above $9.00. Until the market can find a legitimate concern with the soybean planting pace and/or early growing conditions in Brazil, I’m not sure from a supply side perspective the money will want anything to do with accruing length in soybean futures. The market still feels range bound.
Additional Charts & Resources:
Thanks for reading.
Twitter: @MarcusLudtke
Data References:
- USDA United States Department of Ag
- EIA Energy Information Association
- NASS National Agricultural Statistics Service
Any opinions expressed herein are solely those of the author, and do not in any way represent the views or opinions of any other person or entity.


