Corn futures continued to leak lower this week, making a new contract low on Friday at $3.62 ¼. Before finishing at 3.64.
What is causing the downward slide in corn futures and will it continue? Let’s review the latest corn market news and price analysis.
On Monday (3/4) the corn and soybeans futures markets got a boost from a report via Goldman Sachs suggesting that China, as part of trade deal with the U.S., was contemplating purchasing $30 billion more per year in U.S. Ag products (including soybeans, corn, and rice).
U.S. ethanol purchases were also mentioned as part of the negotiations. U.S. Ag Secretary Sonny Perdue seemed to offer a similar sentiment in comments also made last weekend that indicated U.S. exports of soybeans, rice, beef, ethanol and tree nuts could double or triple as part of an agreement with China.
On Friday (3/8) the CFTC continued to issue the second of bi-weekly Commitment of Traders reports, which has been the pattern since the U.S. Government reopened. The Managed Money net short in corn increased to -176,777 contracts as of the market closes on 3/5/2019.
Since 2012 there has only been one other occasion where Money Managers have carried a net short in corn over a similar time period, that coming in 2016. Conversely in 2018, the Managed Money position in corn was +59,120 contracts (same approximate date).
In 2017, the Managed Money position in corn was +82,135 contracts (same approximate date).
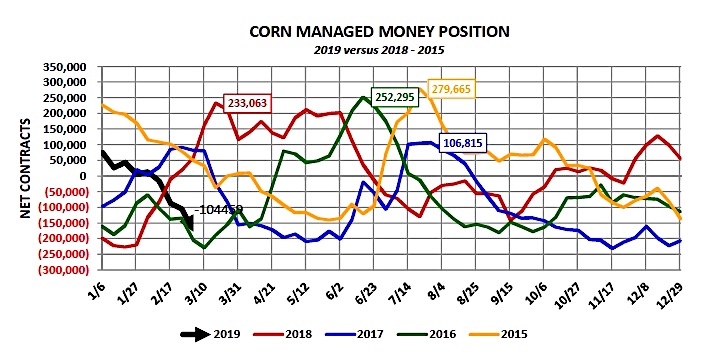
What’s surprising is that in 2018 and 2017 U.S. corn carryin stocks were projected to be in excess of 2.1 to 2.2 billion bushels; and yet despite this massive supply cushion heading into spring planting, Money Managers were still willing to carry a net long heading into March. This year we have the complete opposite scenario with 2019/20 U.S. corn carryin stocks currently estimated at just 1.835 billion bushels and still the Managed Money net short in corn continues to expand. At some point in late March/early April I expect a major shift in this position.
On Friday (3/8) on the USDA issued its March 2019 WASDE report. In that report the USDA increased 2018/19 U.S. corn ending stocks 100 million bushels to 1.835 billion bushels. The USDA’s revision was well above the average trade guess of 1.736 billion bushels.
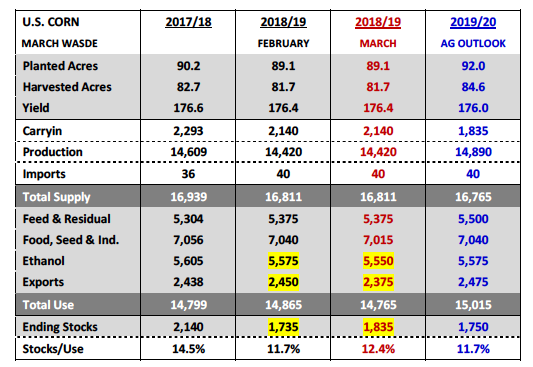
2018/19 U.S. corn exports were lowered 75 million bushels to 2.375 billion bushels. 2018/19 U.S. corn-ethanol demand was cut 25 million bushels to 5.550 bushels. Of the two demand cuts, the one I was not anticipating was the significant reduction to U.S. corn exports. It’s worth noting that the most recent Weekly Export Sales report showed crop year-to-date U.S. corn export sales totaling 1.595 billion bushels, 1% below a year ago as of 2/28/2019. 2017/18 U.S. corn export exports finished the marketing year at 2.438 billion bushels. Therefore I was expecting at most a 25 million bushels cut in this report.
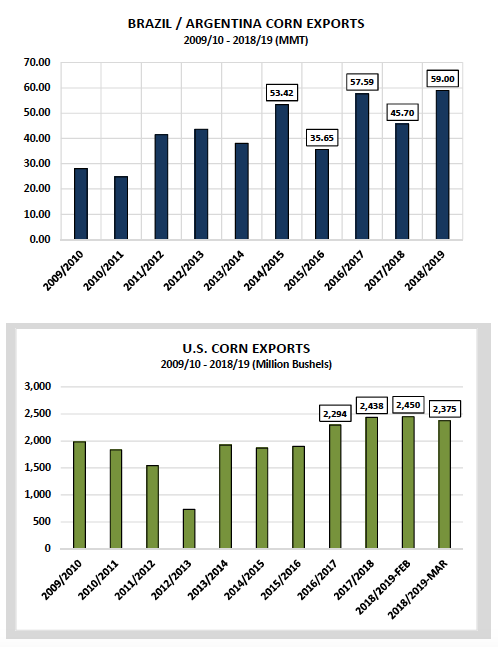
Why was the USDA so aggressive with their U.S. corn export reduction?
The USDA estimated 2018/19 Brazil/Argentina corn exports at a combined 59 MMT in the March WASDE report, up 1 MMT from a month ago and 13.3 MMT higher than a year ago.The belief is that both countries will start to displace some U.S. corn export business moving forward.
MAY CORN FUTURES TRADING OUTLOOK
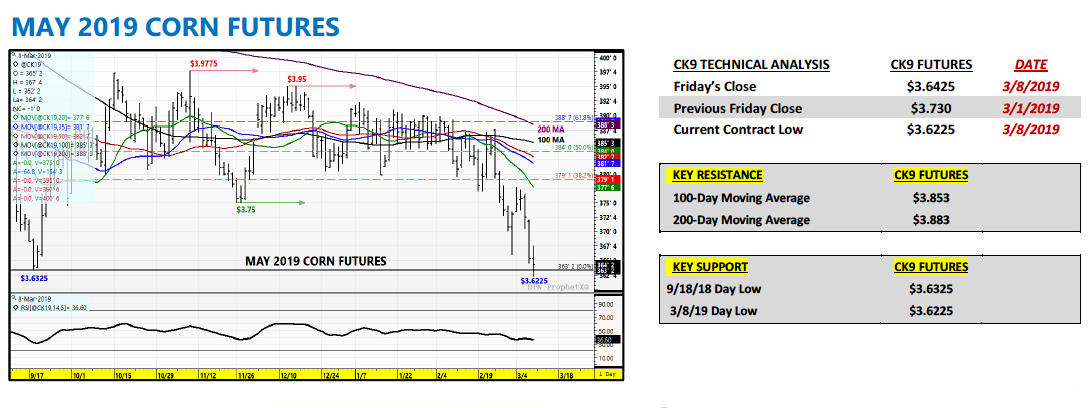
The selling pressure continues to come via Money Managers, who have been adding corn shorts since essentially the 3rdweek of January. What’s inspiring their desire to continue selling corn? That’s an excellent question and one I don’t have an answer for.
The “go to” response from market analysts has been the slowing pace of U.S. corn exports. With Argentina’s corn exports expected to reach a record high 30 MMT in 2018/19 combined with an additional 29 MMT of corn exports from Brazil, traders fear a much more challenging and competitive export market during the 2ndand 3rdquarters of 2019. That said even with the USDA’s revised 2018/19 U.S. corn export forecast of 2.375 billion bushels, 2018/19 U.S. corn ending stocks are still projected to drop 305 million bushels crop year-on-year.
Furthermore I remain unconvinced U.S. farmers are going to plant 2.9 million more corn acres in 2019 with the new crop soybean (SX19) / corn (CZ190 price ratio still trading at 2.40.
I could easily see a scenario where U.S. farmers “only” add 2.0 million corn acres this spring (economics and weather). If the U.S. corn yield slips to just 172 bpa, U.S. corn ending stocks would fall to approximately 1.256 billion bushels (stocks-to-use ratio of 8.4%).
The last 2 years it has been much more difficult to paint a Bullish U.S. corn S&D scenario. That’s not the case with 2019/20.
And when you consider that even last year December 2018 corn futures managed to rally up to a calendar year high of $4.29 ½ on May 24th, 2018, I’m not about to change my longer-term market bias with CZ19 closing at $3.88 ¼ on Friday afternoon.
Twitter: @MarcusLudtke
Author hedges corn futures and may have a position at the time of publication. Any opinions expressed herein are solely those of the author, and do not in any way represent the views or opinions of any other person or entity.

: Worrisome to Broader Market?")


