HIGHLIGHTS FROM NOVEMBER 2019 WASDE REPORT:
Friday’s November 2019 WASDE report contained very few surprises. However, there were some minor adjustments made to the U.S. corn supply and demand balance sheet.
They included:
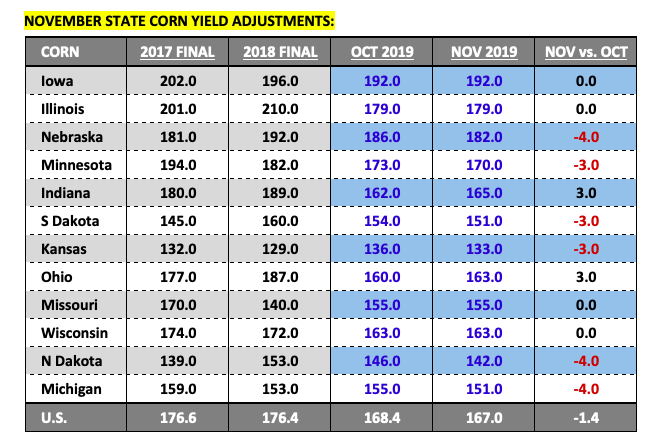
The USDA lowered the 2019/20 U.S. corn yield 1.4 bpa to 167.0 bpa. This was slightly below the average trade guess of 167.5 bpa.
Several key corn producing states experienced monthly yield declines. Nebraska’s corn yield decreased to 182 bpa, down 4 bpa from October and 10 bpa below its record yield from 2018. Minnesota, South Dakota, and Kansas all incurred 3 bpa yield reductions.
Meanwhile North Dakota and Michigan saw their state corn yields come off 4 bpa versus October. That said there were two notable state corn yield increases. Both Indiana and Ohio enjoyed 3 bpa yield improvements with Indiana’s corn yield revised upward to 165 bpa and Ohio estimated at 163 bpa.
Total 2019/20 U.S. corn production fell to 13.661 billion bushels, down 118 million bushels from October. This figure however was still higher than the average trade guess of 13.643 billion bushels due entirely to 2019/20 U.S. corn harvested acreage remaining unchanged at 81.82 million acres.
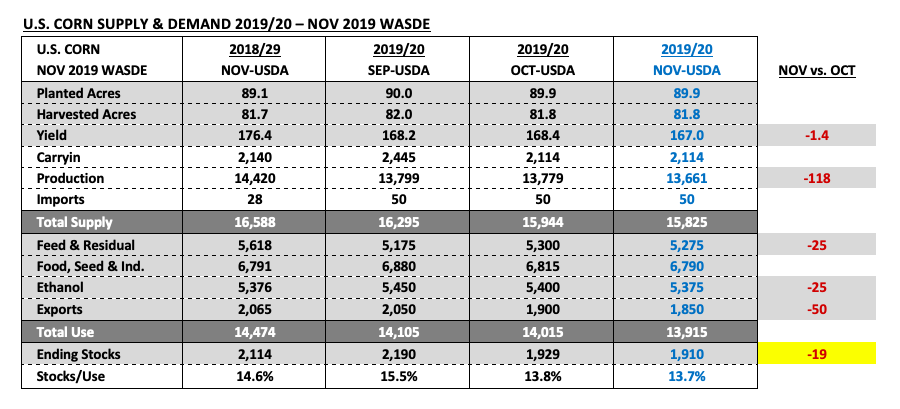
The trade was projecting a decrease to harvested acreage approximating 355,000 acres. If there was a surprise I would argue it was that the USDA did NOT adjust North or South Dakota’s harvested acreage bases from a month ago despite the now well-publicized snowstorm that impacted larges sections of both states in mid-October. South Dakota’s corn harvested acreage figure was static at 3.92 million acres; as was North Dakota’s at 3.31 million acres.
Corn Bulls will now have to wait until the January 2020 WASDE report (released on 1/10/2020) for the USDA’s next assessment on yield. It’s worth noting however that in 4 out of the past 5-years the USDA has lowered the U.S. corn yield from November to January; the largest decrease being -2.5 bpa in 2018/19.
On the demand side the USDA made cuts to all 3 major corn demand sectors. 2019/20 U.S. corn exports were lowered to 1.850 billion bushels, down 50 million bushels from October and 215 million bushels less than 2018/19. 2019/20 U.S. corn-ethanol demand was reduced 25 million bushels to 5.375 billion as was feed-residual use, which was revised down to 5.275 billion bushels.
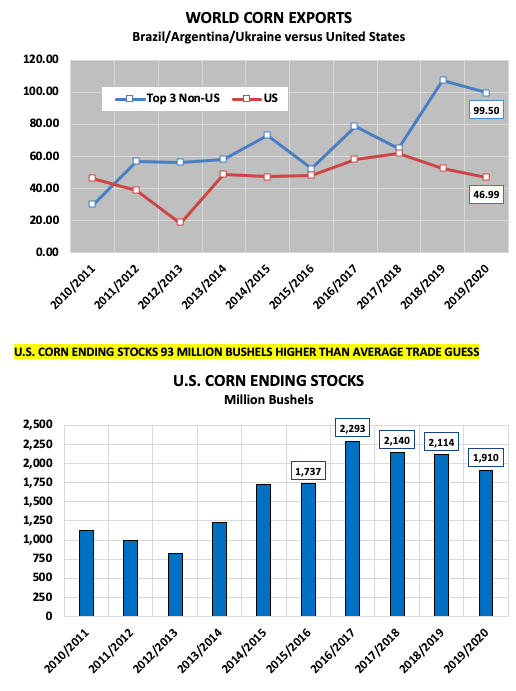
The net of the USDA’s S&D adjustments resulted in 2019/20 U.S. corn ending stocks of 1.910 billion bushels, down just 19 million bushels from a month ago and 93 million bushels higher than the average trade guess.
As far as the World corn supply and demand figures were concerned there were no significant changes.
2019/20 Brazil corn production was left unchanged at 101 MMT; equal to 2018/19’s production figure. Argentina’s corn production estimate was 50 MMT; down just 1 MMT from the prior crop year. Corn exports from the top 3 non-U.S. suppliers (Brazil, Argentina, Ukraine) were projected to hit 99.5 MMT in 2019/20, down 7.8 MMT from 2018/19 but still the 2nd highest figure ever. And World corn stocks (not including China) were lowered to 100.66 MMT, down 6.73 MMT from October.
In soybeans, the USDA left the 2019/20 U.S. soybean yield unchanged at 46.9 bpa versus the average trade guess of 46.6 bpa. Total production was also unchanged at 3.550 billion bushels, 40 million bushels higher than the average trade guess. On the demand side the USDA did lower crushings 15 million bushels to 2.105 billion. Therefore, the net impact on 2019/20 U.S. soybean ending stocks was a 15 million bushel increase versus October. Stocks improved to 475 million bushels, which was still down an incredible 438 million bushels versus 2018/19.
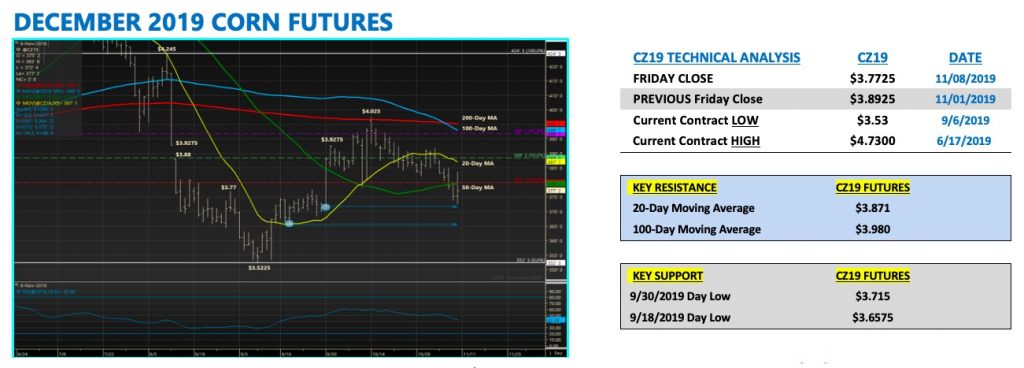
Corn futures attempted to rally on Friday following the release of the USDA’s November 2019 WASDE report; however that move largely failed. CZ faded into the close and still finished 12-cents lower week-on-week.
U.S. Corn Futures Trading Outlook
Was there a “Bullish” takeaway from the November Crop report?
Clearly the best angle for Corn Bulls was (and is) to try and exploit the decrease to the U.S. corn yield combined with recent history, which suggests there’s a strong probability the U.S. corn yield will again be reduced in the January 2020 WASDE report. The problem, however, is that even if the USDA matches the largest November to Final corn yield decline of 2.5 bpa over the last 5-years, that alone would only reduce 2019/20 U.S. corn production 202 million bushels.
If U.S. corn demand holds steady at 13.915 billion bushels, 2019/20 U.S. corn ending stocks would still pencil back at 1.708 billion bushels. And again that’s assuming U.S. corn demand remains unchanged between now and the January report, which from my vantage point appears unlikely. I believe there’s still room to lower all 3 major demand sectors in proceeding WASDE reports.
The other long-term price negative that Corn Bulls will now encounter is the USDA’s recent Baseline 2020/2021 U.S. corn acreage estimate of 94.5 million acres (+4.7 million versus 2019/20), as well as, their 2020/21 U.S. corn ending stocks forecast of 2.754 billion bushels. Clearly the USDA believes there will be a substantial stocks cushion heading into the new-crop year, aided in large part by a sizable planted acreage increase. That said even if 2019/20 U.S. corn ending stocks eventually do fall to 1.700 billion bushels, that hardly moves the needle regarding the early Bearish slant on the 2020/21 U.S. corn supply and demand balance sheet.
Obviously a lot can and will change between now and the January report; however I’m not expecting a huge adjustment in the current CZ19 trading range. If something does shake corn out of hibernation I’m going to assume it will have to come from South American weather problems and/or the “phase 1” U.S. – China trade deal. However, I still believe the “phase 1” trade deal greatly favors soybeans more than corn…unless it includes some elimination of the current tariffs on U.S. ethanol. Stay tuned…
Twitter: @MarcusLudtke
Author hedges corn futures and may have a position at the time of publication. Any opinions expressed herein are solely those of the author, and do not in any way represent the views or opinions of any other person or entity.

: Worrisome to Broader Market?")
