July corn futures closed up 32-cents per bushel week-on-week (through Thursday), finishing at $4.36 ¼ on May 30.
Let’s dig into recent data and news and discuss some catalysts for the rally… and what to expect going forward.
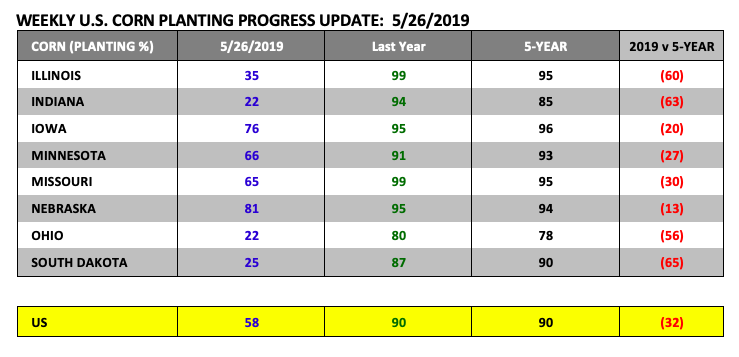
Monday’s Weekly Crop Progress report showed U.S. corn planting at just 58% complete as of May 26th versus 90% last year and the 5-year average of 90%. The trade was looking for a number ranging from 58 to 61%. Severe planting delays were noted once again in the Eastern Corn Belt with Illinois just 35% planted versus 99% in 2018, Indiana 22% planted versus 94% in 2018, and Ohio 22% planted versus 80% in 2018.
In the Western Corn Belt, South Dakota’s corn planting progress was reported at a meager 25% versus 87% a year ago. Therefore as of 5/26/2019, those 4-states still had to plant 18.8 million corn acres (20% of the total U.S. corn acreage base). Insane…
Welcome to the 2019 weather market.
Corn and Soybean traders have been waiting for this type of price volatility since 2012 and now that it’s here the phrase “be careful what you wish for” feels appropriate.
I personally have a love-hate relationship with these types of markets. In one sense “market panic” generates price opportunities that wouldn’t otherwise present themselves. 2019 serves as the perfect example, considering just 3 weeks ago July corn futures were well on their way over the proverbial cliff following the USDA’s May 2019 WASDE report, which offered a 2019/20 U.S. corn ending stocks estimate of 2.485 billion bushels (the largest carryout since 1987/88). This led to July 2019 corn futures trading down to a new contract low of $3.43 on May 13th.
Meanwhile, Money Managers were getting rich on their record short corn positions with U.S. farmers contemplating changing occupations. Fast forward to present… Money Managers have now squared those same short corn positions, many taking losses in the process, following a 95-cents per bushel low-to high move in July corn futures in just 11-trading sessions. As for U.S. corn producers…those with acres already seeded, they’re trying to figure out how to add additional market length with December 2019 corn futures hovering near $4.50 cents per bushel, the highest CZ has traded since 2015. Only in America, and arguably only in commodities where values are largely dictated by something as unpredictable as the weather, can fortunes seemingly change this fast.
What’s the best way to attack this market going forward for those wanting to eventually sell into this up move?
Really it’s all a matter of perspective, with two primary schools of thought evolving regarding the sustainability and longevity of this rally above and beyond Wednesday’s day highs (CN19 $4.38, CZ19 $4.54). The first being those that believe this is the start of a much bigger move, fixated on the possibility of total U.S. planted corn acreage falling 6 to 8 million acres below the USDA’s March Prospective Plantings forecast of 92.8 million acres. That same group is also gravitating to the presumption that a below-trend U.S. corn yield is inevitable (166 to 168 bpa). That math will generate some fun conclusions for 2012 Corn Bulls suggesting total U.S. corn production of somewhere between 12.85 to 13.34 billion bushels versus the USDA’s May forecast of 15.03 billion.
With no demand changes that would leave 2019/20 U.S. corn ending stocks of 305 to 795 million bushels, which in theory can’t happen. That said, demand rationing would need to occur to ensure a stocks-to-use ratio closer to 7 to 8% at a minimum, which means total U.S. corn demand would have to be cut by 600 to 800 million bushels. At that point pick a dollar value that produces that type of rationing…$6 corn, $7 corn? In 2012, under similar supply-side circumstances that were drought related, December corn futures rallied up to a day high of $8.49 on August 10th, 2012 before prices finally exhausted the upside and the appropriate demand destruction occurred (providing a “manageable” U.S. corn balance sheet). I told you, 2012 Corn Bulls are having some fun with current acreage and yield prospects.
The second school of thought is vastly different. My disclaimer…I fall into this second category, which I will blame on 20 years of trading corn futures.
That said, contrarians point to the most recent changes to the 6 to 10-day and 8 to 14-days forecasts, offering for the first time it seems this “spring” an extended period of warmer and dryer weather during the first 10 days of June.
I see a window now to get a high percentage of both the remaining corn and soybean acres planted. And yes I understand and have identified preventive planting dates, as well as, the economics of taking prevent plant. However I’m not ready to discount U.S. corn yield potential based on what I’ve seen since 2014. U.S. corn yields continue to amaze even under less than ideal growing conditions. And finally, we can’t dismiss 2019/20 U.S. corn carryin stocks totaling 2.1 billion bushels or record collective corn production from Brazil, Argentina, and Ukraine. Meaning not only does the U.S. have a huge supply cushion; U.S. corn demand is not good.
A strong case can be made the USDA vastly over-estimated 2019/20 U.S. corn demand in the May 2019 WASDE report. This type of thinking lends itself to being far more aggressive in taking advantage of current rallies versus waiting for a potential 2012 price sequel.
Again I know my audience would prefer I join the chorus of academics, professors, and Twitter experts pontificating a more Armageddon type view of the 2019 growing season.
Like I said, I’m from Minnesota, a life-ling Vikings fan. I have a history of being disappointed. It’s etched in my DNA. Therefore my advice…use options to play the long side, but don’t forgo some of the best pricing opportunities in more than 4 years.
JULY CORN FUTURES TRADING OUTLOOK
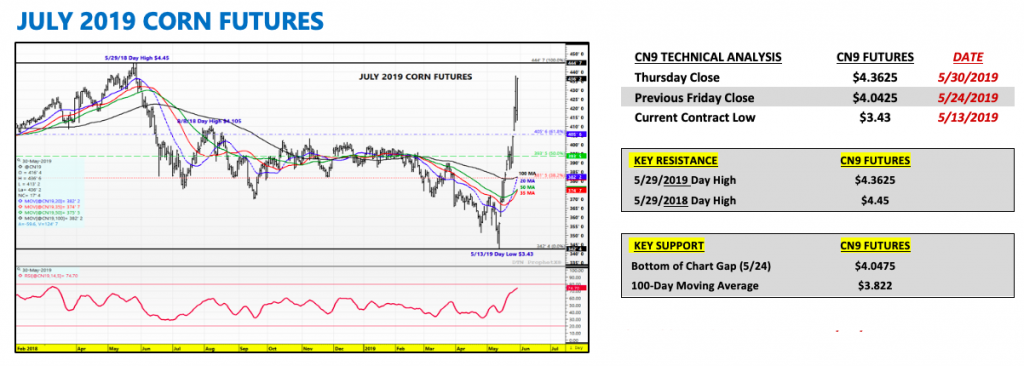
On Thursday, the corn market roared back to its 12-month highs after showing signs of potentially having exhausted the topside on Wednesday afternoon.
The reality is there’s enough uncertainty at this point surrounding planted acreage, early June weather, and yield to keep futures values elevated through the USDA’s June 11th, 2019 WASDE report at a minimum. Traders will want to see what the USDA does with planted acreage and yield in that report and right now Corn Bulls (and Twitter) are controlling the narrative. That said I think it’s worth noting that over the last 10-years there’s only been one occasion where the USDA has lowered planted corn acreage in the June WASDE report, that coming in 2011. That year the USDA lowered planted acreage 1.5 million acres from May to June.
In fact, even in the last major flood year of 1993, the USDA didn’t lower planted acreage until the July WASDE report. I’m not saying the USDA won’t make an exception this year. Clearly it would seem they have more than enough objective ammunition to justify cutting planted acreage well in advance of the June 28thAcreage report. However…the USDA also has a history of being about as predictable as a summer weather market when it comes to them not making Supply & Demand revisions that would seem a foregone conclusion to the vast majority of trade analysts.
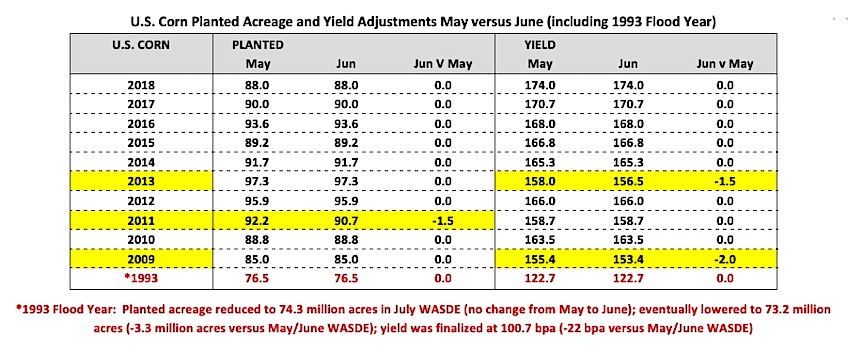
That said I do think it’s likely the USDA lowers its 2019/20 U.S. corn yield estimate in June. They’ve lowered their May to June corn yield estimate 2 times in the past 10-years (-1.5 bpa in 2013 and -2.0 bpa in 2009). Once again…it’s not necessarily common; however if they follow their own guidelines for adjusting their “trend-line” yield forecast prior to July this would be the year. This was noted in the USDA’s May 2019 WASDE summary for corn:
“The yield projection of 176.0 bushels per acre is based on a weather-adjusted trend assuming normal planting progress and summer growing season weather, estimated using the 1988-2018 time period.”
Planting progress has not been normal…it would seem they have to lower the yield.
Topside pricing objectives—- I think there are a lot specs short corn calls above the market. My guess is the squeeze is on. Typically when volatility spikes (which it has; ATM option vol trading +40%) the CME raises margin
requirements. This will only exacerbate the pain being felt by specs, Money Managers fending off margin calls. This is when the market gets stupid. I still want to take advantage of “stupid.” I don’t believe this is 2012…I’ve said that already. I’m saving some sell powder for the short call squeeze; however long-term upside I still favor long calls versus long futures or short puts. Avoid the whipsaw. Remember Money Managers were celebrating just 3-weeks ago.
Twitter: @MarcusLudtke
Author hedges corn futures and may have a position at the time of publication. Any opinions expressed herein are solely those of the author, and do not in any way represent the views or opinions of any other person or entity.

: Worrisome to Broader Market?")
