May corn futures moved up sharply on 3/31, resulting in an 8-cents per bushel higher weekly close, finishing on Friday (3/31) at $3.64 ¼.
Friday’s close was a big win for Corn Bulls in desperate need of a price positive fundamental trend change, which came in the form of a March Prospective Plantings U.S. corn acreage estimate nearly 1 million acres BELOW the average trade guess…additional details below.
MARCH 31st PROSPECTIVE PLANTINGS REPORT SUMMARY:
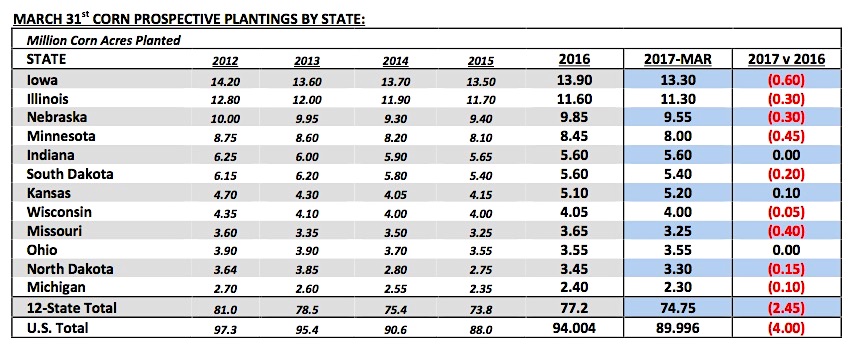
The USDA’s March Prospective Plantings estimate for total 2017 U.S. corn acreage was 89.996 million acres versus the average trade guess of 90.969 million acres and 2016 final planted acreage of 94.004 million.
This marked only the 2nd time in the past 7 crop years that U.S. planted corn acreage has fallen under 90 million. Key state-by-state corn acreage adjustments for the nation’s top 2 corn producers were as follows:
- Iowa’s 2017 planted corn acreage was estimated at 13.3 million acres, down 600,000 acres from 2016 and the lowest planted acreage forecast for Iowa since 2006’s 12.6 million acres.
- Illinois’s 2017 planted corn acreage was estimated at 11.3 million acres, down 300,000 acres from 2016 and the lowest planted acreage forecast for Illinois since 2003’2 11.2 million acres.
- Point of emphasis…in 2016 Iowa and Illinois produced nearly 5.0 billion bushels of corn combined, accounting for approximately 33% of total U.S. corn production. Therefore with planted acreage expected to be down 900,000 acres total in those 2 states (-3.5%), this should have a tangible impact on 2017 U.S. corn production prospects. I would consider this a minor victory for Corn Bulls.
The USDA’s March Prospective Plantings estimate for 2017 U.S. soybeans acreage was 89.482 million acres (record high) versus the average trade guess of 88.214 million acres and 2016 final planted acreage of 83.433 million. Key state-by-state soybeans acreage adjustments included the following:
- Iowa’s 2017 planted soybean acreage was estimated at 10.1 million acres, up 600,000 acres from 2016; Iowa is the U.S.’s 2nd largest state soybean producer, trailing only Illinois.
- Minnesota’s 2017 planted soybean acreage was estimated at 8.25 million acres, up 700,000 acres from 2016.
- Nebraska’s 2017 planted soybean acreage was estimated at 5.7 million acres, up 500,000 acres from 2016.
- Kansas’s 2017 planted soybean acreage was estimated at 5.0 million acres, up 950,000 acres from 2016.
- North Dakota’s 2017 planted soybean acreage was estimated at 6.9 million acres, up 850,000 acres from 2016.
- Collectively those 5-states accounted for 3.6 million additional soybean acres of the 6.049 million acre year-on-year increase nationwide; in 2016 those 5-states represented 40% of total U.S. soybean production.
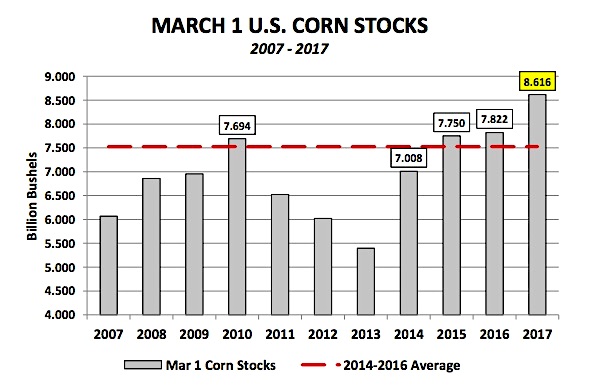
March 1st, 2017 U.S. corn stocks were forecasted at 8.616 billion bushels versus the average trade guess of 8.534 billion bushels and 3/1/2016 stocks of 7.822 billion bushels. The only other time in history that March 1 corn stocks have exceeded 8.0 billion bushels was in 1987 (8.249 billion bushels). March 1st, 2017 U.S. soybean stocks were forecasted at 1.735 billion bushels versus the average trade guess of 1.684 billion bushels and 3/1/2016 stocks of 1.531 billion bushels. The current March 1st soybean stocks projection is the largest since 2007’s 1.787 billion bushels.
KEY CK7 PRICING CONSIDERATIONS FOR THE WEEK ENDING 3/31/2017: May corn futures (CK7) closed on Friday (3/31) at $3.64 ¼ finishing up 8-cents per bushel week-on-week.
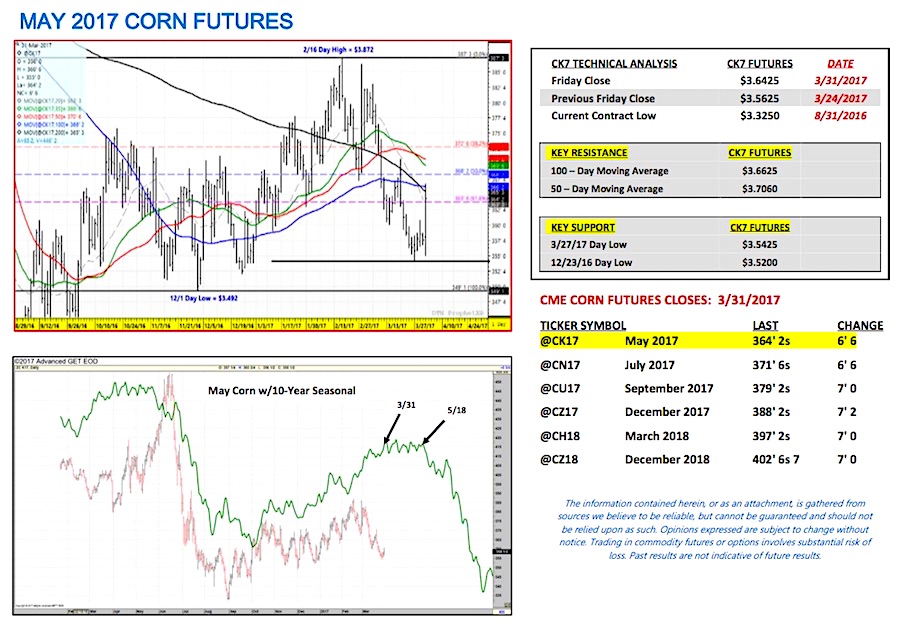
Key takeaways from this week’s price action:
- Friday’s market reaction was pretty telling in both corn and soybeans as far as interpreting how traders felt about the 2017 March Prospective Plantings report and March 1 Stocks estimates with May corn futures closing up 6 ¾-cents per bushel versus a 17-cents per bushel lower close in May soybeans futures that afternoon. That said the reality is for both commodities, summer rallies will likely be predicated on less than ideal growing conditions leading to below-trend U.S. corn and soybeans yields. On paper both acreage estimates still suggest massive 2017/18 U.S. corn and soybean ending stocks in excess of 2.35 billion bushels in corn and 500 million bushels in soybeans if “trend-line” yield estimates are applied (approximately 170.5 bushels per acre in corn and 48.5 bushels per acre in soybeans).
- Friday’s Commitment of Traders report showed money managers once again aggressive sellers of corn for the third consecutive week. As of the market close on 3/28 the Managed Money net short in corn had increased to -155,512 contracts. This represented the largest net corn short money managers had carried since October 4th, 2016 (-162,858). That said I don’t foresee them increasing their net short position exposures beyond approximately -170,000 contracts. Last April, money managers started buying back a similar net short, resulting in the money transitioning from being short -161,865 contracts on April 5th, 2016 to long +79,781 contracts on April 26th, 2016.
Technically Corn Bulls need May corn futures to build on Friday’s positive price turnaround early next week; ultimately a close over the 100-day moving average of $3.66 ¼ is necessary to generate new buy signals. This would likely result in Managed Money short-covering…
Thanks for reading.
Twitter: @MarcusLudtke
Author hedges corn futures and may have a position at the time of publication. Any opinions expressed herein are solely those of the author, and do not in any way represent the views or opinions of any other person or entity.
Data References:
- USDA United States Department of Ag
- EIA Energy Information Association
- NASS National Agricultural Statistics Service


