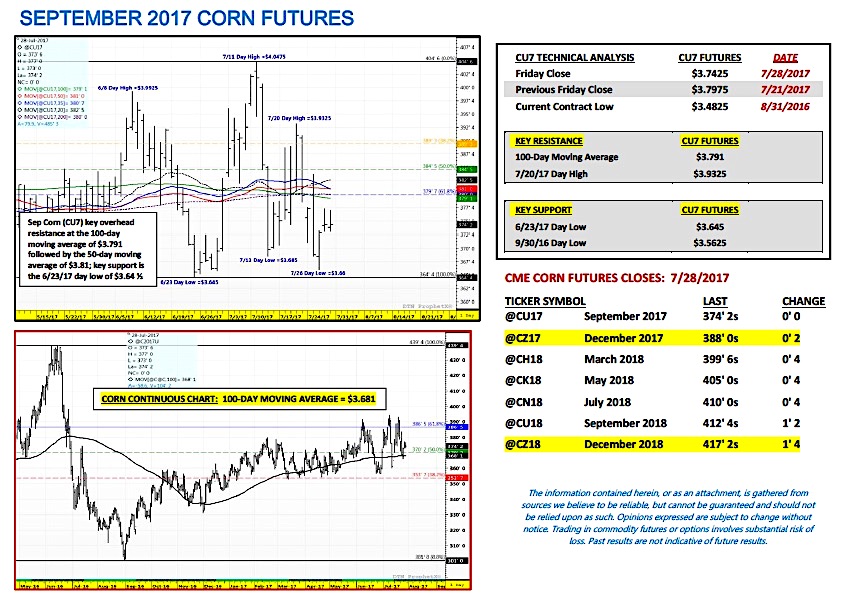
September corn futures moved slightly lower this week, closing down 5 ½-cents per bushel week-on-week, finishing on Friday (7/28) at $3.74 ¼.
Despite another cut to the U.S. corn good-to-excellent rating on Monday afternoon, corn futures and the corn ETF (NYSEARCA:CORN) still couldn’t manage a higher weekly close further frustrating Corn Bulls.
Weekly Corn Price Drivers:
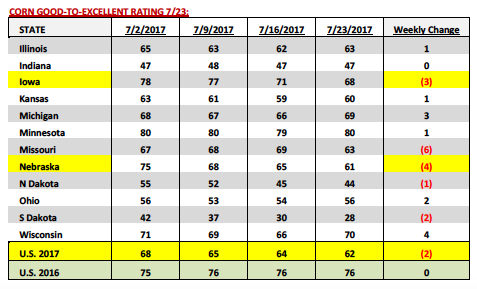
U.S. Corn Crop Ratings: Monday’s Crop Progress report showed the U.S. corn good-to-excellent rating falling 2% week-on-week to 62% versus 64% last week and 76% last year. Iowa for the second week in a row endured another notable slide in its good-to-excellent rating. Iowa’s corn crop was rated 68% good-to-excellent, down 3% week-on-week and 10% below its rating at the beginning of July (on July 2nd IA was rated 78% good-to-excellent). Nebraska also saw a material decline in its good-to-excellent rating, which fell 4% week-on-week to 61%. Nebraska’s corn rating has now decreased 14% during the month of July.
Despite both corn and soybean conditions falling Monday afternoon, which once again underscored the growing negative differential between the 2017 U.S. corn crop and last summer’s record-setting production figure, September corn futures closed DOWN 8 ½-cents per bushel on Tuesday (7/25). How is that possible? The reality is more and more traders are still coming to the conclusion that despite the challenges to this summer’s Midwest growing season (specifically in North and South Dakota) the 2017/18 U.S. corn yield isn’t likely to fall below 162 to 164 bpa (down approximately 10 bpa below last year, -6 to -6.5%). That type of U.S. corn yield would still leave 2017/18 U.S. corn ending stocks near 1.8 billion bushels, well above the 5-year average of 1.579 billion bushels.
U.S. Corn Demand: I’ve been suggesting to my clients for weeks that the one major weakness of every current Bullish argument for corn futures is the expectation that the USDA will lower the U.S. corn yield in the August WASDE report but leave total 2017/18 U.S. corn demand unchanged. That rarely happens. My experience in tracking the USDA’s monthly supply and demand adjustments suggests that tangible (5 to 6 bpa) corn yield reductions are often met with demand decreases that offset at least a percentage of the net impact on U.S. corn ending stocks. For example in 2011/12 the USDA lowered the U.S. corn yield 5.7 bpa from July to August, which resulted in U.S. corn production falling 556 million bushels month-on-month.
HOWEVER to offset or “balance” its supply side decline, the USDA also lowered total U.S. corn demand 340 million bushels versus July, which included a 150 million bushel cut to Feed & Residual Use. Point being as it relates specifically 2017/18…if the USDA cuts the U.S. corn yield in the August report (5 to 6 bpa) I fully expect them to also lower total U.S. corn demand.
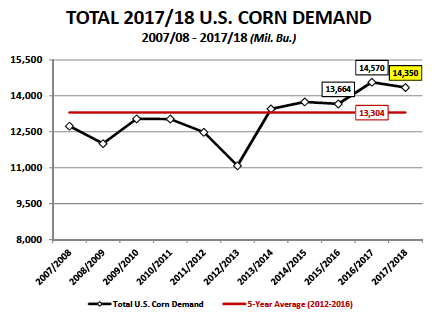
Furthermore the most likely usage sector to see a decrease would be Feed and Residual Use, which is currently estimated at its highest level since 2007/08 (see chart below). The “residual” side of that figure tends to be the USDA’s go-to mechanism for “hedging” its production adjustments up or down in the August, September, and October WASDE reports (prior to large harvest samples sizes being collected with actual yield results).
Key Price Considerations For Corn Traders:
Corn bulls and bears currently in a standstill – If you step back and simply look at the price action this week you’ll find that for the all the passionate pleas from both Corn Bulls and Corn Bears alike, attempting to sway public opinion on the “real” state of this year’s 2017 U.S. corn crop, corn futures largely treaded water in a relatively narrow trading range. The weaknesses in both the Bullish and Bearish narratives for corn futures I believe are as follows:
- Corn Bulls have yet been unable to convince the majority that the U.S. corn yield is going to fall below 162 to 164 bushels per acre. For every one Corn Bull suggesting this year’s U.S. corn yield is headed toward 160 bpa or lower; there seems to be an army of Bears waiting and ready with enough antidotal evidence to dismiss this possibility. I read this week that the average U.S. corn good-to-excellent rating since 1986 has averaged just over 62% good-to-excellent, which is therefore nearly equal to this year’s rating as of July 23rd. Add in ample carryin stocks and a suspect Feed and Residual Use demand forecast and the argument for U.S. corn ending stocks below 1.7 to 1.8 billion bushels just doesn’t seem that plausible for 2017/18.
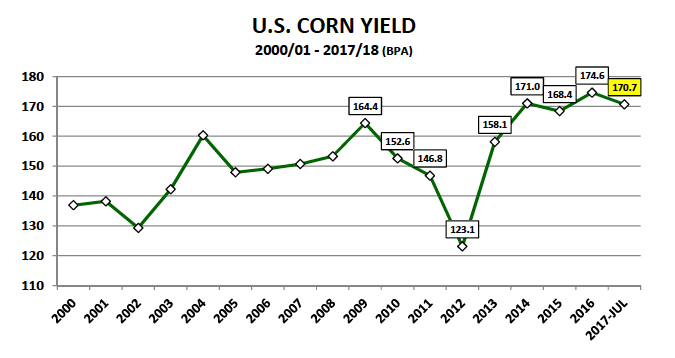
- Conversely, Corn Bears have been unable to prove that this year’s U.S. corn yield is still close to trend-line (trend-line = 170.7 bpa). Clearly with North/South Dakota, Nebraska, sections of Iowa all experiencing some level of drought-like conditions combined with reports of excessive moisture in Indiana and Ohio, the probability of this year’s 2017/18 U.S. corn yield replicating the historically unprecedented record to near record yield results achieved in 2014, 2015, or 2016 appears extremely small. Therefore the reality of a 164 to 166 bpa final U.S corn yield means 2017/18 U.S. corn ending stocks in a range of 1.76 to 1.93 billion bushels. That type of carryout isn’t supportive of sustained price breaks below $3.65 in September corn futures.
Therefore the combined weaknesses of both narratives could essentially lead to a sideways, range bound market moving forward…one that can’t break too far but also can’t rally too far.
Twitter: @MarcusLudtke
Author hedges corn futures and may have a position at the time of publication. Any opinions expressed herein are solely those of the author, and do not in any way represent the views or opinions of any other person or entity.
Data References:
- USDA United States Department of Ag
- EIA Energy Information Association
- NASS National Agricultural Statistics Service

: Worrisome to Broader Market?")

