MARCH CORN FUTURES: Key Pricing Considerations For The Week Ending 12/9/2016:
The March corn futures rally settled at $3.59 ½ on Friday (12/9), finishing up 12 ¼-cents per bushel week-on-week.
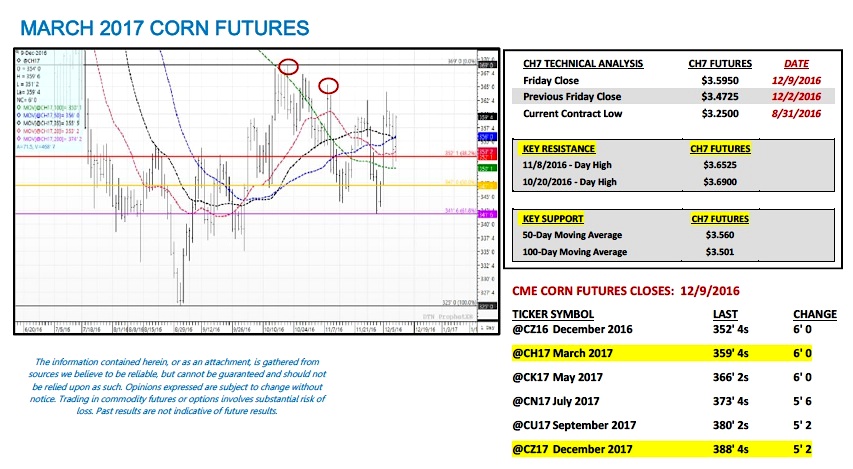
It was an impressive and welcomed recovery in corn futures following a disappointing performance the week prior. The real question now is can March corn futures take that all important next leg higher in prices and eventually challenge the October 20th day high of $3.69? I still believe additional rallies above nearby key resistance ($3.65 ¼ followed by $3.69) will prove difficult into calendar year-end for the following reasons:
- 2016/17 U.S. corn stocks remained unchanged at 2,403 million bushels, a 29-year high; in the USDA’s December 2016 WASDE report. I don’t foresee that figure being materially lowered going forward. If anything I’m going to assume traders will now be positioning for the possibility of the USDA raising the 2016/17 U.S. corn yield in the January 2017 WASDE report given the fact that the last adjustment the USDA made was a 1.9 bpa U.S. corn yield increase from October to November.
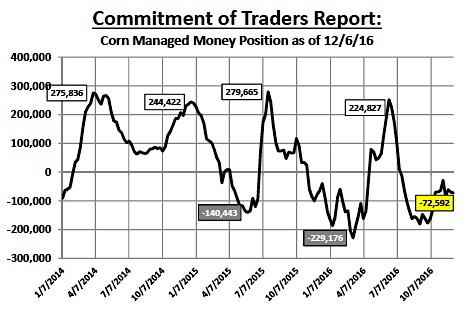
- The latest Commitment of Traders report showed Money Managers increasing their net corn short to -72,592 contracts as of the market close on Tuesday, December 6th. That said the last time Money Managers carried a net long in corn was on July 12th, 2016 (+8,702 contracts). The “money” has yet to shift to the long side of market and I’m not expecting any sense of urgency to do so until the primary market focus shifts to the 2017/18-crop year and the possibility of a sizable U.S. planted corn acreage cut next spring.
Therefore I’m still leaning on the side of rewarding rallies to key resistance into the end of the year.
Thanks for reading.
Twitter: @MarcusLudtke
Author hedges corn futures and may have a position at the time of publication. Any opinions expressed herein are solely those of the author, and do not in any way represent the views or opinions of any other person or entity.
Data References:
- USDA United States Department of Ag
- EIA Energy Information Association
- NASS National Agricultural Statistics Service


")


