Inside the March corn futures rally: The corn market enjoyed a sharply higher trading prices early last week as momentum pushed March Corn Futures (CH7) up as high of $3.64 per bushel (its highest level since 11/8) on Tuesday.
Corn prices would eventually give back some of those gains through Friday’s close, however overall it proved to be a good week for Corn Bulls.
So what prompted the aggressive March Corn Futures rally on Monday?
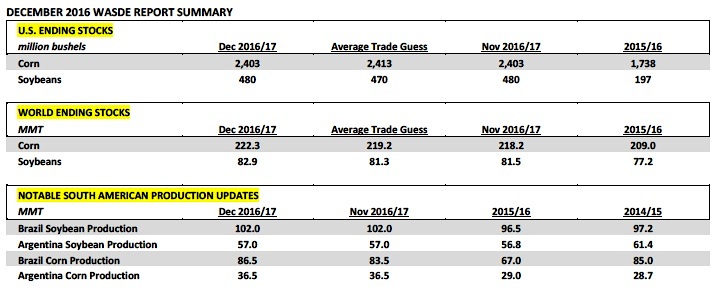
Traders appeared to be focused on good export sales and shipments of both U.S. corn and soybeans. The USDA’s weekly export inspections report on Monday morning showed U.S. corn inspections (shipments) of 53.8 million bushels, above the pace necessary to meet the USDA’s current 2016/17 U.S. corn export estimate of 2,225 million bushels. On Thursday U.S. corn export sales came in even higher at 58.9 million bushels, bringing year-to-date sales up to 1,243.2 million bushels versus 713 million bushels a year ago as of the week ending 12/1/2016. However, even with encouraging export inspections and sales figures, the USDA chose not to raise its 2016/17 crop year corn export forecast in Friday’s December 2016 WASDE report.
As far as the December 2016 WASDE report was concerned, the USDA made no adjustments to either the 2016/17 U.S. corn or U.S. soybean balance sheets. However there were some adjustments made to the world figures. World ending stocks for both corn and soybeans were raised to new record high levels for 2016/17, which also came in above the average trade guesses for the report. 2016/17 World corn stocks were estimated at 222.3 MMT with World soybean stocks forecasted at 82.9 MMT. Despite a seemingly Bearish December WASDE report, corn futures still managed to close in positive territory Friday afternoon. That said my focus remains primarily on the continued pricing ramifications of the USDA’s recently released “Baseline” U.S. corn S&D projections for 2017/18 through 2026/27.
Additional Reaction to the USDA’s “Baseline” U.S. Corn S&D Tables:
On Tuesday, November 29th the USDA released its “Baseline” U.S. Supply and Demand tables for a variety of commodities including corn for crop years 2017/18 through 2026/27. In last week’s commentary I spoke primarily about the USDA’s anticipated cut to U.S. planted corn acreage in 2017/18 of 4.5 million acres (forecast showed 90.million corn acres for 2017/18 versus 94.5 million in 2016/17). However there were some other interesting takeaways from the USDA’s data regarding its long-term opinion on U.S. corn yields and total U.S. corn demand through 2026/27.
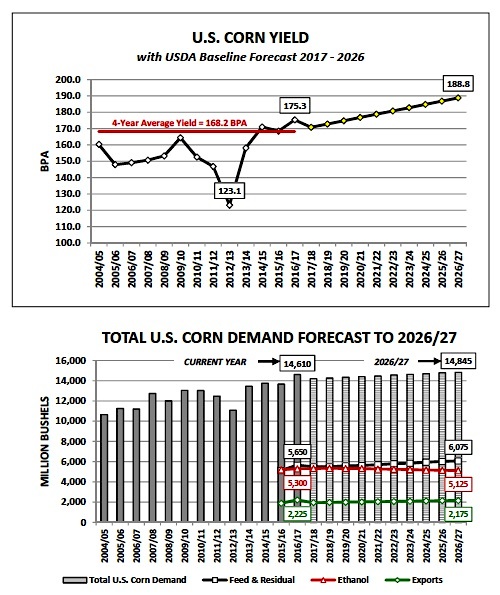
- U.S. Corn Yields: The USDA issued a trend-line U.S. corn yield estimate of 170.8 bushels per acre for 2017/18 versus the most current yield forecast for 2016/17 of 175.3 bpa and the 3-year average yield of 171.6 bpa. The USDA’s yield curve then increases by 2 bpa from 2017/18, peaking at 188.8 bpa in 2026/27.
That said what have the last 10-crop year’s shown, as far as, actual U.S. corn yield performance is concerned? The 10-year pattern shows considerably more volatility. From 2007/08 through 2016/17 U.S. corn yields averaged 156.4 bpa, which includes an extreme low-to-high range of 123.1 bpa in 2012/13 to 175.3 bpa in 2016/17. The reality is final U.S. corn yield results have shown extreme variations from crop year-to-crop year even with the continued advancements in seed genetics.
Therefore I do feel at present the market is in danger of being “lulled to sleep” by the recent unprecedented run of record-to-near record U.S. corn yields in 2014, 2015, and 2016. I’d advise caution before assuming another +168 bpa yield in 2017 as a foregone conclusion. Need I remind Corn Bears…even if I exclude the devastating drought reduced corn yield from 2012/13; the average U.S. corn yield from 2007/08 through 2013/14 was “just” 154.3 bpa with a high-water mark over those 6-crop years in 2009/10 of 164.4 bpa.
- Total U.S. Corn Demand: The USDA’s “baseline” forecasts for total U.S. corn demand were very telling on a number of levels, none of them necessarily supportive to corn futures above $4.00 per bushel both short or long-term. The USDA is currently projecting record 2016/17 total U.S. corn demand of 14,610 million bushels. However the USDA lowered its 2017/18 total usage estimate to 14,215 million bushels, down 395 million. Furthermore the USDA’s long-term S&D tables did NOT show U.S. corn demand exceeding the 2016/17 high until 2023/24 (14,635 million bushels), 7 crop years from present.
Therefore what the USDA’s stagnant total demand figures suggest is that major corn rallies will likely necessitate a significant supply-side downward correction (combination of lower acreage and yield 2017/18) reducing U.S. corn stocks.
continue reading on the next page… (U.S. Corn Price Outlook)

: Worrisome to Broader Market?")


