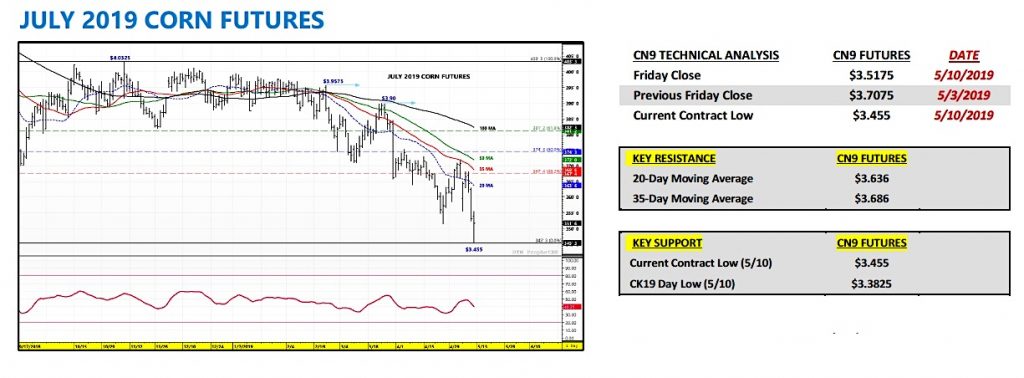
July corn futures closed down 19-cents per bushel week-on-week, finishing at $3.51 ¾ Friday afternoon.
Combination of Tariff Hike and Evaporating Demand Too Much for Corn/Soybean Futures to Overcome…
Friday was not a good day for U.S. farmers. Friday morning the Ag markets received news that President Trump had indeed followed through on his threat to raise tariffs to 25% (more than double the original tariff) on $200 billion of Chinese goods.
The negative consequences of this seemingly never-ending trade war now undeniable with spot soybean futures trading down to their lowest level since December 2008 on Friday morning (day low of $7.95 ¼). Hours later the USDA released its May 2019 WASDE report.
In that report 2018/19 U.S. soybean exports were cut another 100 million bushels to 1.775 billion bushels, 354 million bushels LESS THAN a year ago (-17%). The lost export demand resulting in 2018/19 U.S. soybean ending stocks coming in just 5 million bushels shy of 1.0 billion bushels.
Keep in mind the previous record high carryout figure in U.S. soybeans was 574 million bushels in 2006/07.
To repeat the obvious, which I’ve stated on several occasions, when you have a country who has historically accounted for up to nearly 60% of total U.S. soybean purchases (over 1.2 billion bushels), and you lose a significant percentage of that market due to retaliatory trade tariffs, the impact on domestic prices will be devastating.
Pre-tariff spot soybean futures prices at the end of May 2018 were trading in a range from $10.20 to $10.50. Now spot soybean futures are struggling to stay north of $8.00 per bushel. That said I’m willing to attribute the vast majority of the 20-24% price decline in soybean futures to continued trade uncertainty with China. The reality is there is no export offset for the U.S. being largely shunned by Chinese soybean buyers.
The USDA went on to forecast new-crop 2019/20 U.S. soybean ending stocks of 970 million bushels, therefore essentially walking the 2018/19 carryout forward and leaving very little optimism for U.S. farmers moving forward.
For corn, the news wasn’t any better for U.S. farmers.
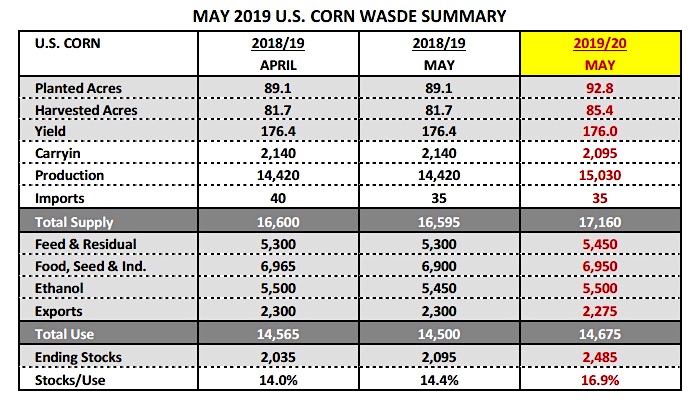
The USDA offered a 2019/20 U.S. corn ending stocks forecast of 2.485 billion bushels versus the average trade guess of 2.131 billion bushels. The USDA made NO downward alterations to its March Prospective Plantings forecast of 92.8 million acres despite more and more analysts suggesting corn acreage will fall 1 to 1.5 million acres. Keep in mind, Monday’s Weekly Crop Progress report showed just 23% of the U.S. corn crop planted as of 5/5 versus 36% a year ago and the 5-year average of 46%.
The other surprise was the USDA made no attempt to account for the delayed start on its trend-line yield estimate of 176 bpa. In 2013 the USDA lowered its initial May yield forecast 5.6 bpa versus its February Ag Outlook estimate. Therefore it’s not unprecedented for them to make an adjustment based on weather; however no such decrease was considered this year.
What does the corn market do from here? I think a strong argument can be made that the high water marks are already in, for the entire 2019/20 crop year, for U.S. corn planted acreage (92.8 million), yield (176 bpa), and ending stocks (2.485 billion).
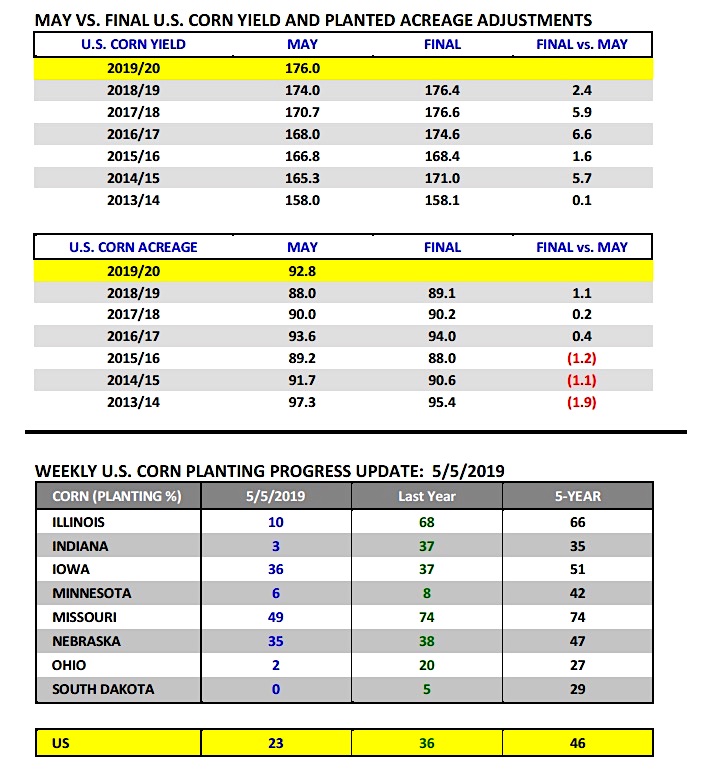
I think you’d be hard pressed to find a reputable grain analyst or trader who believes planted acreage won’t come down by at least 1 million acres. Crop scout Michael Cordonnier also recently forecasted 4 to 5 million of prevent plant acres for 2019 in his weekly wire. Planting conditions have not been good across large sections of the Corn Belt. That said even those acres that did get seeded, they’ve since experienced the continuation of sharply below normal temperatures and excessive precipitation (cold temps will continue thru 5/23).
Most notably Illinois, last year’s banner corn producing state after achieving a record state corn yield of 210 bpa, was just 10% planted as of 5/5 versus 68% last year and the 5-year average of 66%. In general I think most agree 2019’s planting delays are no longer comparable to some of the delays experienced in 2018, and that maximum yield potential has likely already been compromised in several key corn producing states.
One problem area for Corn Bulls however that was addressed in the May WASDE report was U.S. corn export demand.
2018/19 U.S. corn exports were left unchanged at 2.300 billion bushels; however 2019/20 U.S. corn exports were lowered to 2.275 billion bushels. At the USDA’s February Ag Outlook Forum that figure was projected at 2.475 billion bushels. What’s changed? Brazil’s corn production has recovered significantly from 2017/18. In the May report 2018/19 Brazil corn production was raised to a record high 100 MMT, up 4 MMT from the April forecast and 18 MMT higher than a year ago (+709 million bushels). Furthermore Brazil and Argentina combined 2018/19 corn exports were revised upward to 63.5 MMT, 15.9 MMT above 2017/18 (+626 million bushels).
Clearly that’s going to have a negative impact on U.S. corn exports with considerable pain likely felt over the next 3 to 4 months given the timing of Brazil’s safrinha corn harvest (Jun/Jul), which accounts for more than two-thirds of Brazil’s total corn crop.
Can I point to one positive in the corn market to close the week?
Despite President Trump raising tariffs to 25% on Chinese goods, as well as, an initial 2019/20 U.S. corn ending stocks forecast from the USDA of 2.485 billion bushels in the May 2019 WASDE report (largest since 1987/88), July corn futures only closed down 1 ½-cents Friday afternoon.
What does this suggest? I think it’s a strong indication that a number of traders believe as I do, that we likely won’t see a larger ending stocks estimate possibly the rest of the crop year. Meaning, the most Bearish U.S. corn Supply and Demand cards (outside of a final U.S. corn yield exceeding 176 bpa) were likely just played in the May report and have to a large extent already been digested in current prices. And yet as we go home this weekend December corn futures are still trading over $3.70 per bushel. The onus shifts to Corn Bears now to come up with something new to push prices even lower over the next 2 to 3 weeks.
Twitter: @MarcusLudtke
Author hedges corn futures and may have a position at the time of publication. Any opinions expressed herein are solely those of the author, and do not in any way represent the views or opinions of any other person or entity.

: Worrisome to Broader Market?")

