March corn futures closed down 5 cents last week, finishing at $3.78.
The new year is offering up some new challenges and opportunities for the corn market, several revolving around China. Let’s review key news and trends in the market.
China Approves 5 Genetically Modified Crops for Import: On Tuesday China announced they had approved five genetically modified crops for import, including 2 soybean products and 1 corn product.
This announcement was a byproduct of what appeared to be very productive U.S. – China trade talks in Beijing on Monday and Tuesday. Notable analysts already seem to be in agreement that China’s GM approvals shouldpave the way for additional, future imports of U.S. soybeans.
China has recently returned as a buyer of U.S. soybeans (current estimate for Dec thru Jan = approximately 5 MMT), after essentially shifting nearly all of its purchases to Brazil following the implementation of a 25% tariff on U.S. soybeans on July 6th.
U.S. – China trade relations took a step in the right direction following the G20 summit in Argentina on Nov 30th– Dec 1st. That said, the question moving forward is will China now continue buying U.S. soybeans with Brazil’s 2018/19 soybean harvest rapidly approaching?
Even with current private forecasts suggesting Brazil’s 2018/19 soybean crop is heading backwards due to an extended period of “hot/dry” conditions, it still looks like Brazil will harvest a 116 to 118 MMT soybean crop (2nd largest ever). Therefore Brazil will certainly have the ability to displace additional U.S. soybeans sales to China if China decides it’s still not ready to stand down in the trade war.
I’m in the camp of those still needing more proof that China actually intends on returning as a consistent buyer of U.S. soybeans.
I see China’s latest moves primarily as posturing and token gestures of “goodwill” to try and ease trade tensions; however my underlying belief is they will do whatever they can moving forward to eliminate any long-term dependence on the U.S. for their soybean needs. Additionally with Brazil continuing to expand its soybean production, the U.S. has lost considerable leverage in the world soybean export market. China has trade alternatives. Bottom-line it’s going to take more than a press release or “pledge” from China to convince me they’re back for good…
U.S. ETHANOL PRODUCTION DOWN: Wednesday’s EIA report showed weekly U.S. ethanol production continuing to creep lower.
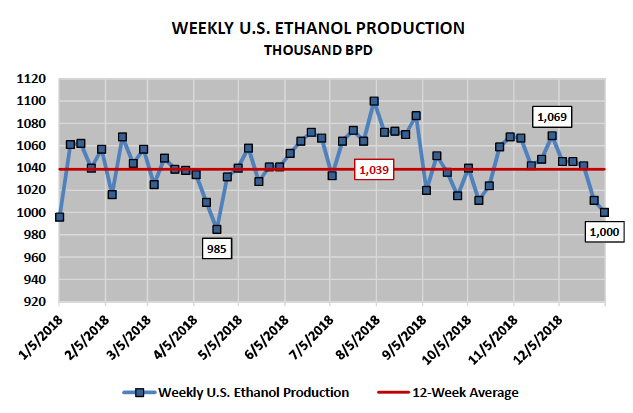
For the week ending January 4th, 2019, U.S. ethanol production averaged 1.000 million barrels per day. That represents the lowest weekly production average since April 20th, 2018 (0.985 million barrels per day). It’s also down considerably from the 12-week average of 1.039 million barrels per day. It should be noted that despite ethanol production trending lower U.S. ethanol stocks increased for the third consecutive week, improving to 23.254 million barrels.
How is that possible? It’s largely a combination of weak gasoline demand and the need for additional U.S. ethanol exports. Ultimately this week’s figures suggest that ethanol production needs to stay depressed moving forward…
Have “Industry Average” ethanol margins seen any improvement?
Yes. Over the last 30-days plant margins have improved approximately 30-cents per bushel due to strong DDGS values and a significant break in natural gas prices. That said industry average ethanol margins still remain negative EBITDA.
CORN FUTURES TRADING OUTLOOK
Late in the week corn and soybean futures prices faded from their weekly highs, which seemed to coincide with Conab’s (Brazil’s National Supply Company) latest 2018/19 Brazil soybean and corn production estimates.
Conab revised its 2018/19 Brazil soybean forecast to 118.8 MMT, down just slightly from its estimate of 120.1 MMT in December (USDA at 122 MMT). They left 2018/19 Brazil soybean exports unchanged at 75 MMT (USDA at 81 MMT). In corn, Conab’s 2018/19 Brazil corn production forecast was also unchanged at 91.1 MMT (USDA at 94.5 MMT) with exports estimated at 31 MMT (USDA at 29 MMT). Corn and Soybean Bulls were disappointed with Conab’s revisions; hoping that the continued pattern of hot and dry conditions in Brazil would have shown a greater deterioration in Brazil’s corn and soybean crops during the month of December and first week of January.
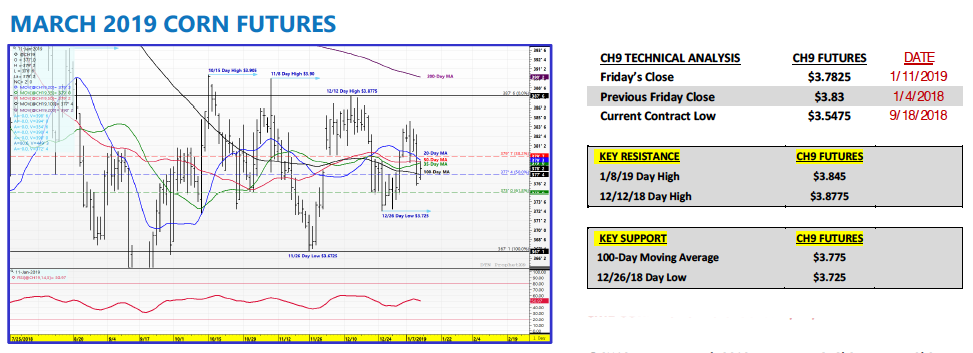
Technical price action in March corn futures still shows considerable price resistance above $3.85 (weekly high was $3.84 ½).
In fact the highest CH9 has traded in the last 60-days is $3.87 ¾ on 12/12/2018. The market really needed the January 2019 WASDE report to be released this week as scheduled on Friday. I believe the Jan report would have shown additional decreases to the 2018/19 U.S. corn and soybean yields. Those downward revisions could have provided the “push” CH9 needed to trigger that next wave of buy paper above $3.85.
As it stands traders are left debating two topics, both of which are wearing out their shelf life in my opinion regarding having a substantial market impact.
1) China and its “sincerity” in reestablishing its presence in the U.S. Ag export markets (Bulls say “yes” China loves U.S. soybeans/corn again; Bears say “no” we’ve heard this song before). 2) Brazil’s expanding hot and dry weather pattern affecting large sections of Brazil’s key soybean/corn growing areas (Bulls say Brazil’s soybean/corn production losses will continue to increase; Bears say the damage has already largely been accounted for). The market says no one is winning the argument, which equals range bound price action and an inability to sustain rallies above key price resistance….
Key “Ag” Statement from the U.S. Trade Delegation’s Meetings in Beijing –
“The talks also focused on China’s pledge to purchase a substantial amount of agricultural, energy, manufactured goods, and other products and services from the United States.”
Twitter: @MarcusLudtke
Author hedges corn futures and may have a position at the time of publication. Any opinions expressed herein are solely those of the author, and do not in any way represent the views or opinions of any other person or entity.
Data References:
- USDA United States Department of Ag
- EIA Energy Information Association
- NASS National Agricultural Statistics Service

: Worrisome to Broader Market?")


