The corn bear market is lasting longer than most expected.
But that’s what bear markets do… and they eventually exhaust themselves.
Corn news and market analysis for the week ahead:
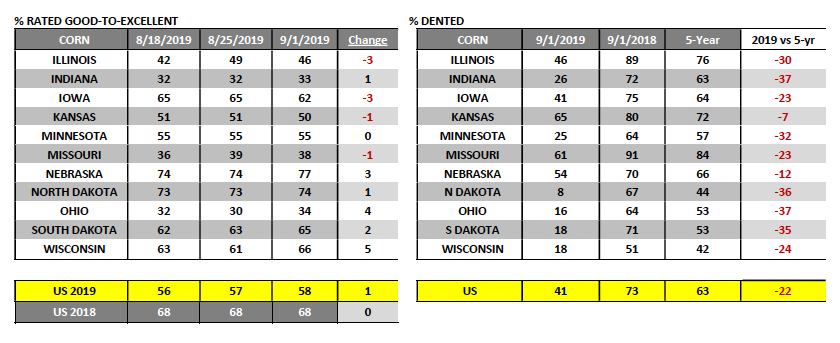
Monday’s Weekly Crop Progress report showed the U.S. corn good-to-excellent rating improving 1% week-on-week to 58% versus 68% a year ago.
That said, notable decreases included Illinois and Iowa’s corn ratings falling 3% week-on-week to 46% and 62% good-to-excellent respectively.
However, if we analyze the monthly changes in the top 2 corn producing states in the country Illinois’s corn rating has improved from 41% good-to-excellent on August 4th to 46% on September 1st, up 5%.
Conversely Iowa’s corn rating has deteriorated slightly dropping from 66% good-to-excellent on August 4th to 62% on September 1st, down 4%. It will be very interesting to see how the USDA chooses to incorporate the state-by-state monthly adjustments in corn condition ratings in the September 2019 WASDE report as it relates to their corn yield estimates (released on 9/12).
In the August 2019 Crop Production report Illinois’s corn yield was estimated at 181 bushels per acre versus 201 bpa in 2018 and 201 bpa in 2017. Meanwhile Iowa’s corn yield was estimated at 191 bushels per acre versus 196 bpa in 2018 and 202 bpa in 2017. Collectively Illinois and Iowa accounted for approximately one-third of the entire U.S. corn crop in both 2018/19 and 2017/18.
Thursday’s Weekly EIA report showed U.S. ethanol production falling to 1.013 million barrels per day for the week ending 8/30/2019.
This compares to production of 1.038 MMbpd the previous week and the 4-week average of 1.030 MMbpd. Despite the production decrease, U.S. ethanol stocks improved to 23.8 million barrels, up 0.8 million barrels week-on-week.
Earlier in the week, it was reported that Brazil would increase its tariff-free ethanol imports to 750 million liters (198 million gallons) for one year. This is up from Brazil’s former quota of 600 million liters (158.5 million gallons). This was viewed as a positive development for a U.S. ethanol industry desperately in need of an expanding export market; however the reality is the increase equated to a relatively inconsequential 40 million gallons. Brazil’s 20% tariff on ethanol imports exceeding 750 million liters remained unchanged.
This week various private U.S. corn/soybeans yield and production estimates were released in advance of next Friday’s September 2019 WASDE report.
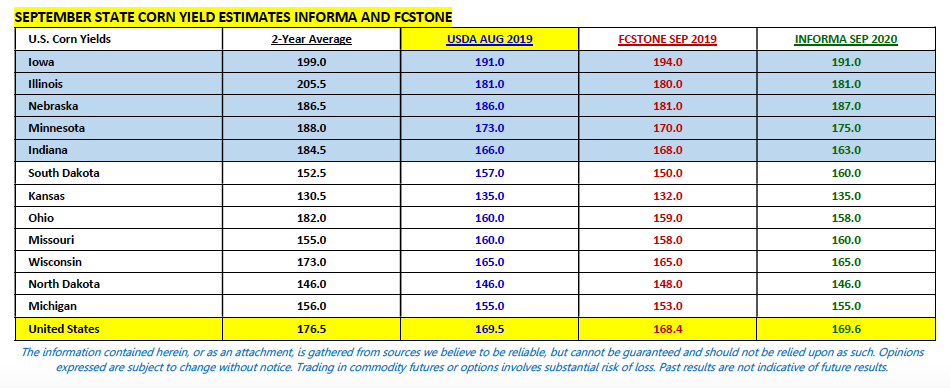
Remembering in August the USDA estimated 2019/20 U.S. corn production at 13.901 billion bushels (yield of 169.5 bpa) with 2019/20 U.S. soybean production forecasted at 3.680 billion bushels (yield of 48.5 bpa). A few of the notable September private estimates were as follows:
- Allendale: Corn production of 13.755 billion bushels (yield of 167.7 bpa); Soybean production 3.499 billion bushels (yield of 46.1 bpa)
- FCStone: Corn production of 13.809 billion bushels (yield of 168.4 bpa); Soybean production 3.661 billion bushels (yield of 48.3 bpa)
- Cordonnier: Corn production of 13.040 billion bushels (yield of 162 bpa); Soybean production 3.470 billion bushels (yield of 46.0 bpa)
- Informa: Corn production of 13.906 billion bushels (yield of 169.6 bpa); Soybean production of 3.671 billion bushels (yield of 48.4 bpa)
Looking at those estimates its apparent almost no one is willing to offer their real opinion on production and yield going into the September 2019 WASDE report.
I will say that considering Illinois’s corn crop was rated just 46% good-to-excellent this past Sunday (9/1/2019) versus 75% a year ago, Indiana 33% versus 72%, and Ohio 34% versus 79%…I have hard time believing this year’s national corn yield will only be down 6.9 bpa versus 2018/19’s final yield of 176.4 bpa. Those 3-states represented nearly 27% of the U.S. corn crop in 2018/19. Even Iowa’s latest good-to-excellent rating of 62% is 12% LESS THAN its rating as of the 1stweek of September in 2018.
Even so, various private forecasters currently have Iowa’s corn yield nearly equal to its 2018 final yield of 196 bpa (see below). Ultimately I believe low test weights prove the outlier in 2019, which will eventually lead to a national corn yield under 165 bushels per acre…time will tell.
Corn futures sold off again this week, continuing a downward slide that has proven essentially unrelenting since the release of the August 2019 WASDE report.
The continued lack of a frost-freeze scare in the extended forecast coupled with an unresponsive audience (for good reason) regarding news of “fresh” China, U.S. trade talks in early October was more than enough to keep corn futures on the defensive. Add to that a growing majority of private crop analysts basically hedging on their September U.S. corn production/yield forecasts versus the USDA’s August figures and what we have is a market without a story. Markets without a story typically endure a slow bleed…and that’s exactly what CZ19 is experiencing.
How did it get this bad, this fast?
The 2019 planted acreage hoax has arguably been the biggest culprit. Let’s not forget less than a month ago pre-August 2019 WASDE report, the average trade guesses for U.S. corn planted acreage, production, and yield were as follows: 87.7 million planted acres, 13.123 billion bushels, and 164.7 bpa.
There were even some notable analysts offering estimates well below those figures. The planted acreage hoax was then further accelerated after the USDA acknowledged they would re-interview 13 of the 18 major corn producing states for the August report so as to recalibrate “actual” versus “intended” acres planted due to large sections of the Eastern Corn Belt still unseeded in mid-to-late June.
Fast forward to present and this is what the market has had to digest… 90 million planted corn acres (even with 11.2 million acres of prevent plant; and down just 1.7 million acres from the June Acreage forecast), 13.901 billion bushels of production (up 26 million from July), and a yield of 169.5 bpa (up 3.5 bpa from July). Throw in losses of significant U.S. corn export demand, lower corn-ethanol demand, the continuation of Chinese tariffs, and the EPA’s recent granting of 31 SRE’s, and I’m not sure a more negative outlook could have been manufactured for the corn market in just 4-weeks time.
How am I positioned under $3.55 CZ19?
I see no reason to be short at current price levels. The 2018 December corn contract low was $3.42 ¼ on 9/18/2018. By 10/2/2018 CZ18 had traded back up to a day high of $3.69. At some point even Bear markets exhaust the downside.
Twitter: @MarcusLudtke
Author hedges corn futures and may have a position at the time of publication. Any opinions expressed herein are solely those of the author, and do not in any way represent the views or opinions of any other person or entity.

: Worrisome to Broader Market?")
