Corn news and market analysis for the week of October 7, 2019.
Here’s a look at recent corn data and news highlights, along with my analysis and outlook for Corn futures prices.
On Monday, the USDA released its September Grain Stocks report, which offered a “Bullish” surprise for corn futures.
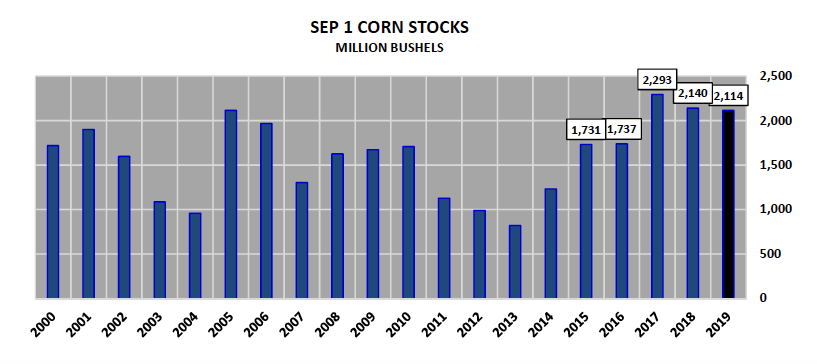
September 1 U.S. corn stocks were estimated at 2.114 billion bushels, 314 bushels BELOW the average trade guess of 2.428 billion.
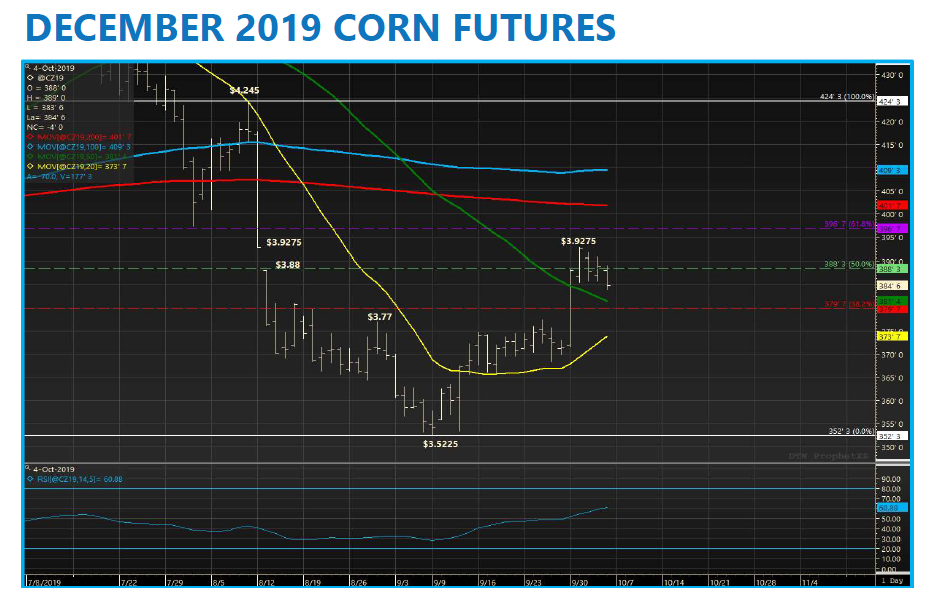
The market immediately responded with CZ19 closing up 16 ½-cents per bushel that afternoon at $3.88, finishing above the 50-day moving average, which had been acting as a major area of price resistance dating back to the last week of July 2019. What were the lasting implications of the USDA’s massive downward adjustment to Sep 1 corn stocks?
What it implied is that the USDA over-estimated the 2018/19 U.S. corn yield by at least 3 bpa when they last forecasted/finalized their 2018/19 U.S. corn production figures in the February 2019 WASDE report.
Therefore instead of a final yield in 2018/19 of 176.4 bpa; current Sep 1 corn stocks indicate (based on 4thquarter disappearance) that last year’s yield was likely closer to 173.0 bpa.
In practicality how this will likely be displayed and accounted for in the October 2019 WASDE report (released next Thursday on 10/10/2019) is through a significant increase to 2018/19 U.S. corn feed & residual use, which was estimated at 5.275 billion bushels in the September Crop report. That figure I’m assuming will go up by at least 300 million bushels, which will help lower 2018/19 U.S. corn ending stocks to 2.114 billion bushels versus the September forecast of 2.445 billion bushels.
What does this mean for the 2019/20 U.S. corn balance sheet?
For one, it means 2019/20 U.S. corn carryin stocks will immediately be lowered to 2.114 billion bushels, which in and of itself drops 2019/20 U.S. corn ending stocks to 1.859 billion bushels (331 million bushels less than September). However more importantly, I think it will also force the USDA to be more conservative on their 2019/20 U.S. corn yield estimate. If last year’s U.S. corn yield was actually closer to 173 bpa, then how is it possible this year’s yield is just 2.8% less than 2018/19 (current estimate is 168.2 bpa)?
I think this is a reasonable question. Given the now well-documented record corn planting delays this spring and early summer, which has culminated in just 43% of the U.S. corn crop now rated “mature” as of September 29th versus 84% last year and the 5-year average of 73%, it would seem highly unlikely that 2019/20 U.S. corn yield potential can come within 6 to 7 bpa of a year ago.
Furthermore Monday’s Weekly Crop Progress report once again had the U.S. corn crop rated just 57% good-to-excellent versus 69% in 2018/19. I remain of the strong opinion that over time we’ll eventually be looking at a final 2019/20 U.S. corn yield closer to 165 bpa.
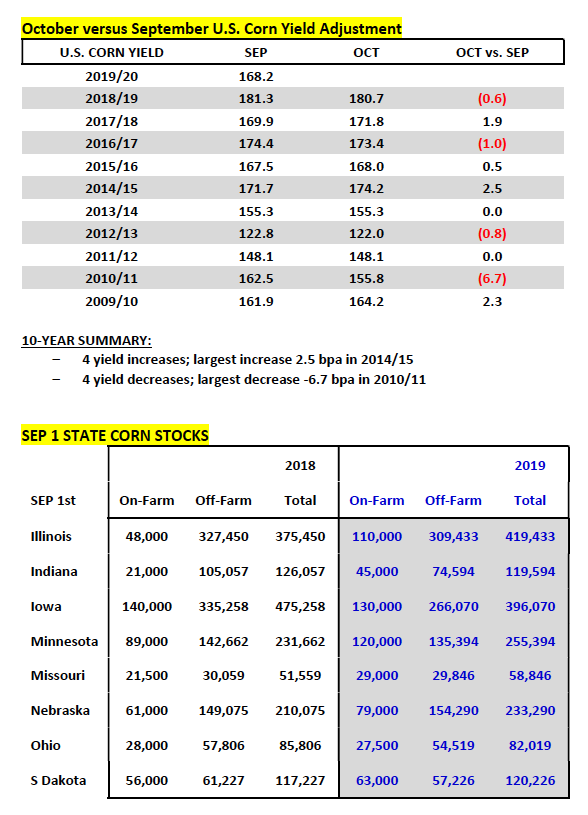
That said, I’m not convinced the USDA will go there in the October WASDE report with just 11% of the U.S. corn crop currently harvested (even though it’s not unprecedented to see that type of yield cut in an October Crop report; in 2010/11 the USDA slashed the U.S. corn yield 6.7 bpa from September to October). And finally, it’s also worth noting that earlier this week FCStone offered a revised October U.S. corn yield estimate of 169.3 bpa; higher than most were anticipating. This included a 196 bpa yield for Iowa, equal to Iowa’s 2018 final state yield (see state-by state FCS yield estimates).
LOOKING AHEAD
For the sake of the argument let’s assume the U.S. corn yield does eventually fall 3 bpa to 165.2 bpa, what would this do to 2019/20 U.S. corn ending stocks? Under this scenario, which also includes a 50 million bushel cut to U.S. corn exports (considering U.S. export sales are down 51% from a year ago YTD), I have 2019/20 U.S. corn ending stocks falling to 1.655 billion bushels; which is a stocks-to-use ratio of 11.8%. This would represent the tightest stocks-to-use in corn since 2013/14’s 9.2%. This could provide the spark for additional Managed Money short covering with Money Managers still thought to be short in excess of 100,000 corn contracts through the market closes on 10/4/19.
The September 30th Grains Stocks report was just the catalyst Corn Bulls needed; igniting a breakout move higher this week in December corn futures. Despite the mini-celebration that ensured following CZ19’s first close back over the 50-day moving average since July 19th, what are some possible reasons for caution regarding December corn’s ability to eventually sustain continuation rallies above this week’s day high of $3.92 ¾?
- The week’s EIA report showed weekly U.S. ethanol production of 958,000 barrels per day; up just slightly from the previous week’s figure of 943,000 barrels per day, which was the lowest weekly run-rate since April 29th, 2016. That said front-end “Industry Average” ethanol margins have improved substantially due to a recent spike in prompt ethanol values. However considering there’s a sizable inverse in ethanol prices, the forward curve doesn’t necessarily incentive those ethanol biorefineries that are currently shut-down (estimated at 15 to 17 plants) to start back up in November or December. Therefore it appears U.S. corn demand for ethanol will remain depressed relative to the past two years into and possible through the end of the calendar year (even with Trump’s biofuel announcement Friday).
- The pace of U.S. corn export sales for 2019/20 is extremely alarming. Thursday’s export sales report showed crop year-to-date U.S. corn export sales totaling 382.3 million bushels versus 775.5 million bushels a year ago; a difference of -393.2 million bushels or -51%. In 2018/19 U.S. corn exports totaled 2.060 billion bushels. In September the USDA was forecasting 2019/20 U.S. corn exports just 10 million bushels less than a year ago at 2.050 billion bushels. When you consider U.S. corn export sales tend to be front-end loaded toward the beginning of the crop year this should be viewed as a major concern and warrants possible reductions to the USDA’s current export forecast sooner than later (February forward fresh South American corn supplies displace U.S. corn exports).
Overall, if December corn futures manages to put a “4” in front of it next week, I’m a seller. I can still find far too many demand offsets even if the U.S. corn yield fades by 3 to 4 bpa in the Oct/Nov WASDE reports.
Twitter: @MarcusLudtke
Author hedges corn futures and may have a position at the time of publication. Any opinions expressed herein are solely those of the author, and do not in any way represent the views or opinions of any other person or entity.


