August WASDE Report Postmortem:
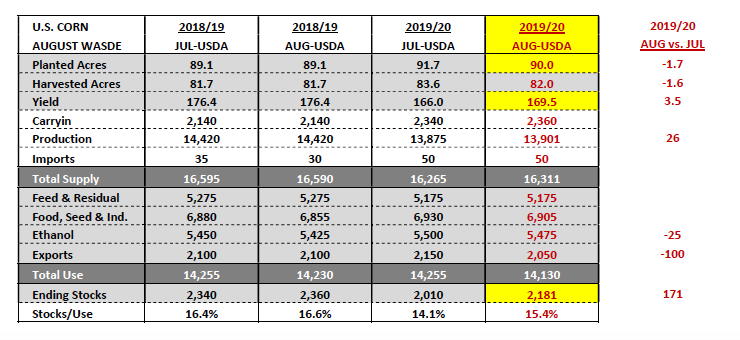
Monday’s August WASDE report was a body blow of epic proportions to Corn Bulls following the USDA’s revised 2019/20 U.S. corn planted acreage estimate of 90 million acres and 2019/20 U.S. corn yield of 169.5 bushels per acre.
Rough day for Corn NYSEARCA: CORN and September Corn futures.
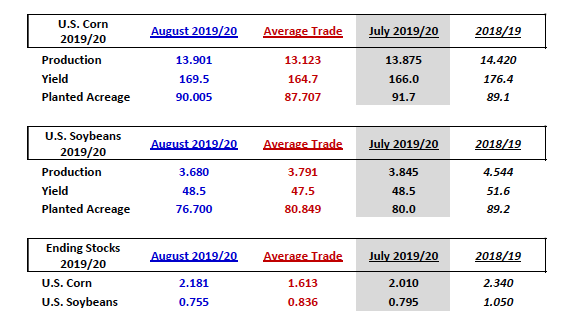
Both figures were well above the average trade guesses of 87.7 million corn acres and 164.7 bpa. Privately I would argue the trade was actually even leaning toward a planted acreage figure closer to 86 million acres. Therefore the market reacted about as expected closing down the limit in corn futures Monday afternoon (-25 cents per bushel); trading synthetically as much as 32-cents lower at times during the session.
What’s the lasting impact of the August WASDE report on corn futures?
There’s no doubt it likely caused irreversible pricing damage moving forward regarding the market’s ability to reestablish rallies above $4.15 in December corn futures (baring an early frost).
2019/20 U.S. corn ending stocks swelled to 2.181 billion bushels, 171 million bushels higher than a month ago and 568 million bushels above the average trade guess. Traders can’t simply dismiss that adjustment on the basis of not “liking” the USDA’s numbers. Furthermore planted acreage conspiracies remain just that with the USDA nearly doubling down on their June 28thplanted acreage estimate of 91.7 million acres.
Even with record prevent plant acres in corn totaling 11.2 million acres (as reported to the FSA), those figures already appear to be digested in the USDA’s updated August planted acreage estimate of 90 million corn acres. And while some have argued that this then implies farmers intended to plant 101.2 million acres of corn in 2019 (casting further doubts), that isn’t necessarily true given the farmer’s flexibility in designating certain prevent plant acres as corn even though they may have intended to plant soybeans.
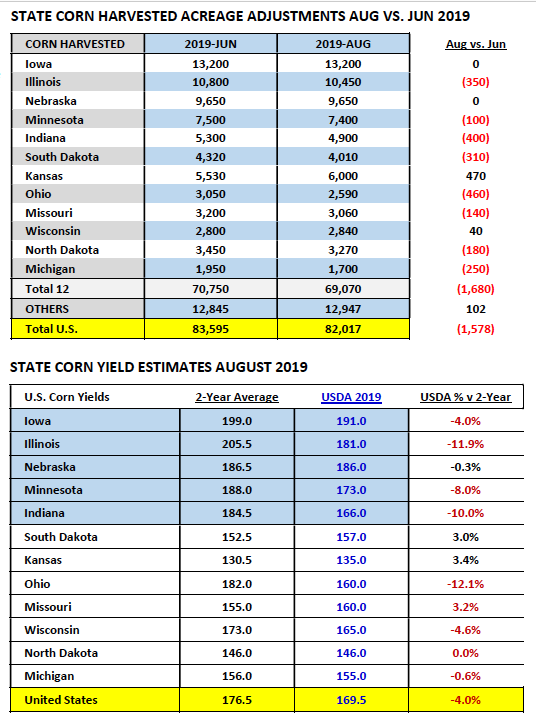
If I was going to craft a bullish acreage argument, I’d now focus on harvested acreage possibly being lowered in proceeding Crop reports. That said even there I wouldn’t expect more than a 1 to 1.5 million acre reduction. In my opinion that’s not enough of a bullish market incentive for Money Managers to reestablish fresh longs during what’s historically a relatively depressed pricing period with just limited upside (Sep-Nov). If you’re a Corn Bull the emphasis needs to shift to yield.
It’s been well-documented the USDA relied on satellites to help estimate the U.S. corn yield in the August WASDE report. I’m going to assume I’m not the only one wrestling with the ability of a satellite to forecast yield potential, especially in 2019.
That said I do think there’s a strong argument the U.S. corn yield comes down over time versus the USDA’s 169.5 bpa forecast in the August report. Monday’s Crop Progress report showed just 57% of the U.S. corn crop rated good-to-excellent (versus 70% a year ago) with conditions in IL and IN continuing to fade. Illinois was rated just 40% good-to-excellent with Indiana rated 33% good-to-excellent. Those are the 2ndand 5thlargest state corn producers in the country respectively.
The largest August to Final U.S. corn yield reductions since 2004 have been -12.4 bpa in 2010/11 and -6.2 bpa in 2011/12 (see page 4 for year-by-year snapshot).
Theoretically if the U.S. corn yield were to fall to 160 bpa in proceeding Crop reports (-9.5 bpa), total U.S. corn production would drop to 13.12 billion bushels with 2019/20 U.S. corn ending stocks dipping to 1.4 billion bushels. Is that type of yield cut possible? I certainly think it’s in play in 2019; however I should add what’s unfortunate is that the ending stocks correlation even with a near 10 bpa decline in yield is no longer producing carryouts below 1.0 billion bushels. 90 million planted corn acres is now providing much more of a supply cushion even on future yield reductions (lowers theoretically price ceiling).
How would I trade this market going forward?
You might not like the answer. In my opinion you can’t ignore the seismic shift in trading ranges now that the USDA has seemingly accounted for prevent plant acres in the August WASDE report. I think its safe to say the Corn Bulls masquerading as University Academics on Twitter have caused enough confusion for one year. I’ve always said if somewhere doesn’t have skin ($money) in the game, their market opinion means as much to me as the amount they’ve wagered.
Corn futures endured a two-day jet wash of Managed Money long liquidation, as well as, panic selling on the part of small specs and even some producers. September corn futures closed down a combined 44 ¼-cents per bushel over the course of Monday’s and Tuesday’s trading sessions, finishing at $3.66 on Tuesday afternoon.
The Bearish magnitude of the August WASDE report continues to set in by the hour with traders of all shapes and sizes equal parts dazed/confused and disgusted. That said I’m convinced another trading opportunity awaits if we can somehow distance ourselves from the emotional carnage of being “long and wrong” (if only on a percentage) and instead focus on just how stupid corn wants to get to the downside with this year’s U.S. corn yield far from a foregone conclusion.
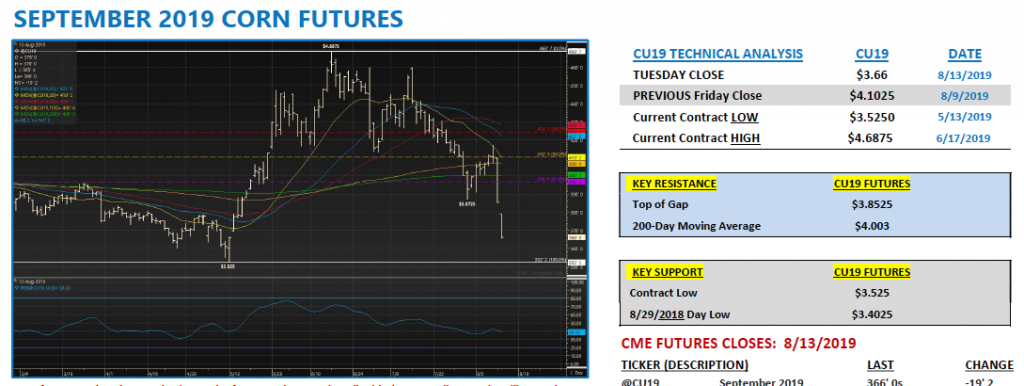
Technically, the September chart now has a nice topside chart gap in it due to this morning’s gap lower opening from $3.85 ¼ to $3.79. I do believe that will be filled if not in the Sep (and prior to First Notice Day on 8/30) then eventually in December corn futures ($3.92 ¾ to $3.88 CZ19).
This then means I obviously believe corn futures will eventually rally back a percentageafter this initial tsunami of selling pressure is exhausted.
In 2018 September corn futures drifted down into the low $3.50’s during last half August (December corn = low $3.60’s); however let’s recall in the August 2018 WASDE report the USDA raised the 2018/19 U.S. corn yield to a record high 178.4 bpa.
In September the USDA got even more aggressive increasing the yield to 181.3 bpa. I’m going to assume that won’t be the market’s impression this year with just 39% of the U.S. corn crop in the “dough” stage as of 8/11 versus 71% in 2018. And as I mentioned earlier this year’s crop is rated just 57% good-to-excellent versus 70% in 2018. Therefore I would argue the high-water marks for the U.S. corn yield and ending stocks probably came in this report (suggesting a higher pricing floor for 2019 versus August/September 2018).
Now this doesn’t mean we can recreate the perceived upside prior to Monday’s report being released.
But I do think if you have the opportunity to trade a new range ($3.55-$3.85 CU / $3.65 to $3.95 CZ) you can still add value even in a market that’s seemingly lost most of its Bullish ammunition. You just have to accept that.
Twitter: @MarcusLudtke
Author hedges corn futures and may have a position at the time of publication. Any opinions expressed herein are solely those of the author, and do not in any way represent the views or opinions of any other person or entity.

 Flirting With Critical Support… Again")


