It was an extremely quiet week for both corn prices and soybeans prices. December corn futures closed Friday at $3.89 ¼, up just a ¼-cent per bushel week-on-week. CZ5 did manage to close over the 100-day moving average at $3.884; however it was far from convincing. November soybeans finished at $8.74 ¼ on Friday, down 15-cents per bushel on the week and well below the 35-day moving average of $8.814.
HARVEST PROGRESS & CROP CONDITION RATINGS: Monday’s Weekly Crop Progress report showed the US corn harvest improving to 18% as of September 27th versus just 11% a year ago and the 5-year average of 23%. Illinois’s harvest percentage increased to 30% versus 13% a week ago. Missouri and Kansas are both over 40% harvested and in effect near equal to their 5-year averages. Iowa, Minnesota, and Nebraska are just getting started at 5%, 3%, and 10% harvested respectively.
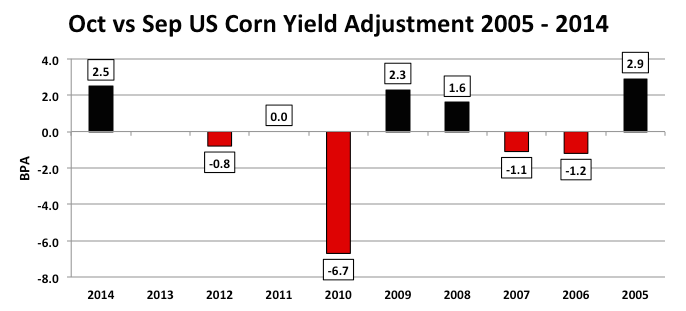
Also of note, the US corn good-to-excellent rating was unchanged for the week at 68% versus 74% in 2014. The corn crop rating hasn’t navigated from 68% since August 30th. This would seem to suggest that a major yield adjustment in the October Crop report is unlikely (which will be released on 10/9). However…for the Corn Bulls in the group, I did look back over the last 10-years and the largest October versus September yield decrease occurred in 2010. That year the USDA lowered the US corn yield 6.7 bpa in the October Crop report to 155.8 bpa, which resulted in the carryout falling to 902 million bushels at that time.
 Was there any indication in the USDA’s preceding Weekly Crop Progress reports that this type of yield decrease was imminent?
Not at all, in fact from September 12th, 2010 through October 11th, 2010 the US corn good-to-excellent rating was essentially unchanged. What was the corn crop rated over that approximate 30-day window? 68% good-to-excellent, exactly the same rating the US corn crop has today. Therefore history suggests that even in the absence of a major ratings decrease from September to October, the US corn yield can still be adjusted significantly in the October WASDE report. One big factor in October 2010 was that 37% of the US corn crop was harvested prior to the release of that report.
The Key Takeaway: Clearly actual harvest results play a much bigger role in estimating the US corn yield in October and November versus the natural subjectivity of crop condition ratings, which tend to be relied upon more so during the spring and summer months. That said I don’t believe a 3 to 5 bpa yield reduction can totally be ruled out at this time even with the good-to-excellent rating holding steady at 68% since the release of September Crop report. Early corn yield results in Illinois, Indiana, and Ohio remain extremely variable. Illinois alone with its 11.65 million harvested corn acres has the ability to influence the national corn yield up or down.
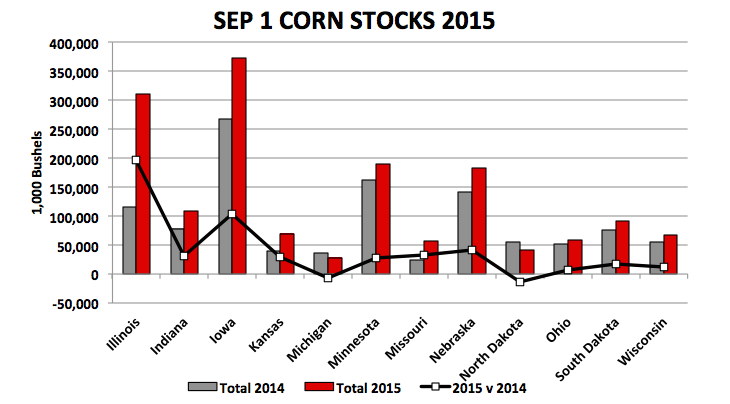
SEPTEMBER 1 STOCKS REPORT: Wednesday the USDA released the September 1 Grain Stocks report. The average trade guess for US corn stocks was 1,739 million bushels versus 1,232 million in 2014. The USDA came in with a figure of 1,731 million bushels, the largest since 2005/06. The market sold-off immediately after the number posted even though it was slightly below the average trade guess. My takeaway was the amount of corn in commercial hands in the Eastern Corn Belt relative to a year ago. Off-Farm corn stocks in Illinois, Indiana, and Ohio were up 169.8 million bushels versus 2014 with most of that increase coming from Illinois. Considering corn production will be down this year specifically in Indiana and Ohio, both commercials and farmers alike are likely to store as much corn as possible looking to generate carry revenue and considerable basis appreciation next June, July, and August.
In soybeans the average trade guess was 205 million bushels versus just 92 million bushels in 2014. The USDA’s actual forecast came back at 191 million bushels. The decrease was due somewhat surprisingly to a 0.3 bpa yield reduction to the 2014 US soybean crop (lowered to 47.5 bpa), as well as, a planted acreage decrease of 425,000 acres (lowered to 83.3 million). Despite the lower stocks projection, the upward price reaction still appears limited due to what many believe will be a record breaking soybean crop in 2015, which is currently in the process of being harvested.
#Unfiltered – CORN & SOYBEANS PRICE FORECAST
I’ve added a new segment this week which is my #unfiltered pricing forecasts for corn and soybeans due to feedback requesting a marketing opinion that eliminates any attempt to massage the unavoidable realities of the current market structure.
continue reading on the next page…

: Showing Some Signs of Emerging Strength")
