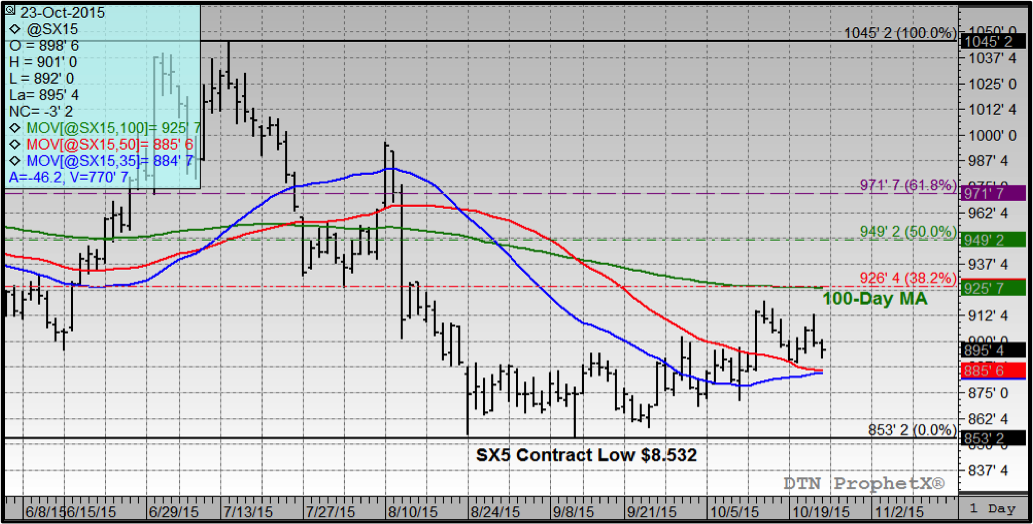
NOVEMBER SOYBEAN FUTURES: The soybean market continues to trade in a fairly well-defined range with rallies above $9.10 SX5 still proving difficult to sustain; as well as, breaks back under $8.80. Traders remain fixated on South American weather developments and specifically its influence on soybean planting progress in Brazil (the world’s largest soybean producer).
At present planting progress in southern Brazil is the most advanced with the state of Parana reportedly approaching 50% complete. Central Brazil however continues to experience planting delays due to dry weather, which includes the largest soybean producing state of Mato Grosso. Internal estimates have Brazil’s total soybean crop now approximately 20% planted.
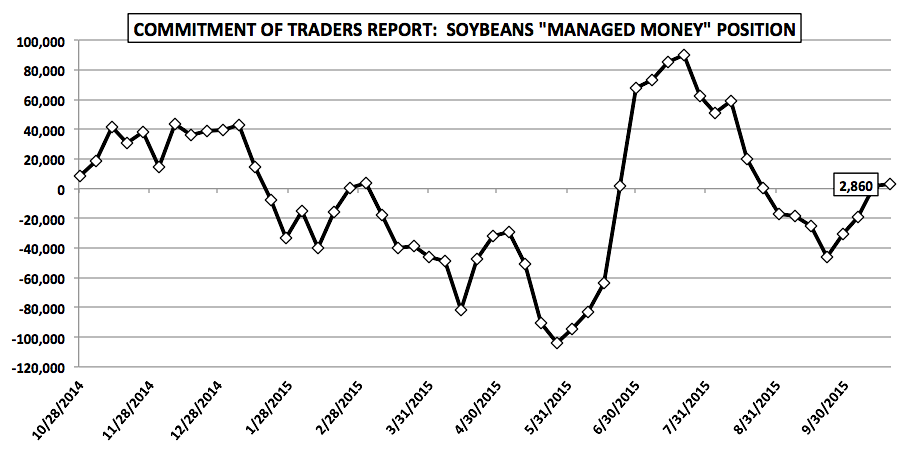
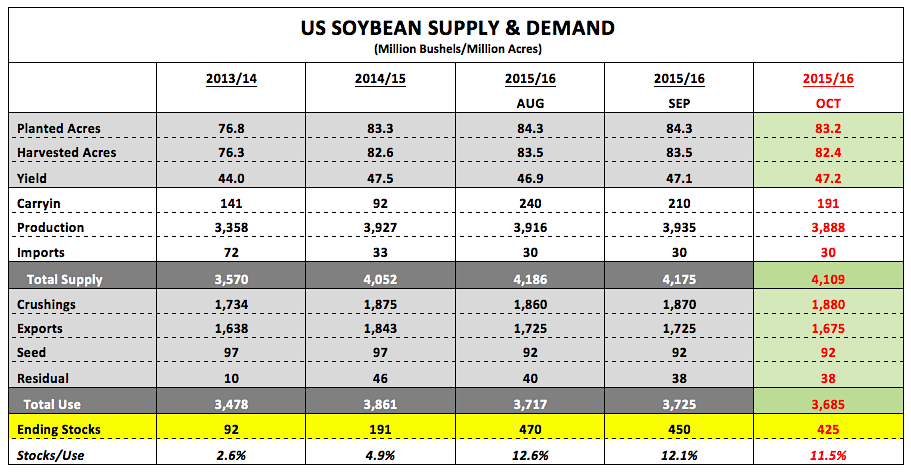
Will perceived planting delays in Brazil be enough to propel soybeans futures over $9.10 to $9.20 per bushel? I wouldn’t rule out a rally up to the 100-day moving average in SX5 of $9.257; however extended rallies above that level remain unlikely at this time. 2015/16 US and World soybeans ending stocks should still work to put a ceiling on prices over the short-term. Friday’s Commitment of Traders report showed the managed money long in soybeans essentially unchanged versus a week ago at 2,860 contracts (see page 3). This would suggest the “money” isn’t all that interested in taking a major position in soybeans, which is being reflected in a futures market that continues to track mostly sideways. Longer-term I do believe there’s value in finding a way to own soybeans going into the spring of 2016 at levels at or below $9.00 per bushel. Something has to give with the risk vs. reward sentiment seemingly favoring the long side with futures prices still trading at their lowest levels since 2009.
November Soybeans Futures Chart
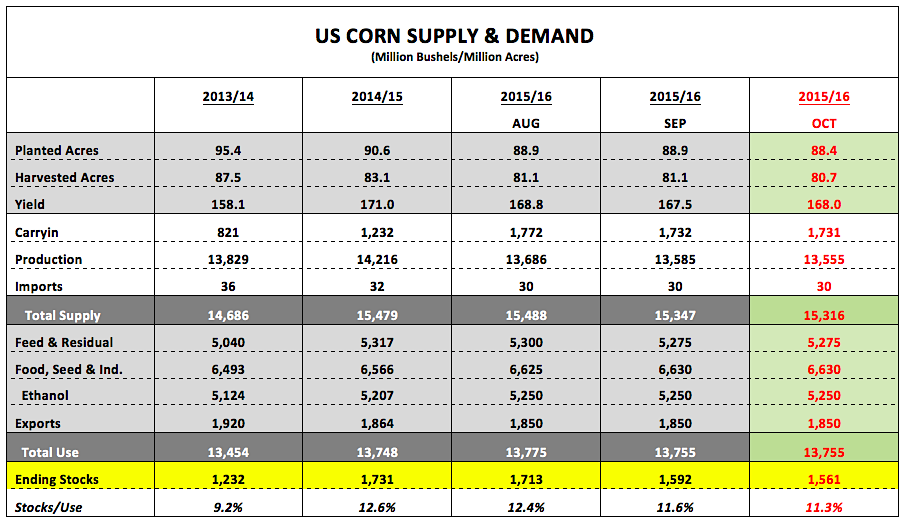
Corn and Soybeans Supply & Demand Charts:
Thanks for reading.
Twitter: @MarcusLudtke
Data References:
- USDA United States Department of Ag
- EIA Energy Information Association
- NASS National Agricultural Statistics Service
Any opinions expressed herein are solely those of the author, and do not in any way represent the views or opinions of any other person or entity.

 Trading Near Top Of Price Range")


