Wednesday morning allowed investors to digest the bulk of the results from Super Tuesday.
Former Vice President, Joe Biden, won states such as Texas and Massachusetts, which came as a surprise to most political analysts.
Biden favors preserving the Affordable Care Act, which was passed while he was Vice President under President Obama. The front-runner entering Super Tuesday was Senator Bernie Sanders. Sanders favors Medicare for All – which, if passed, would dramatically disrupt the existing business models for healthcare companies.
UnitedHealth Group (UNH) Surges After Super Tuesday
The positive result for Biden sent healthcare shares dramatically higher in Wednesday’s session. Herein, we analyze UnitedHealth Group (UNH), which rallied over 10% on the trading day.
Let’s look at the chart.
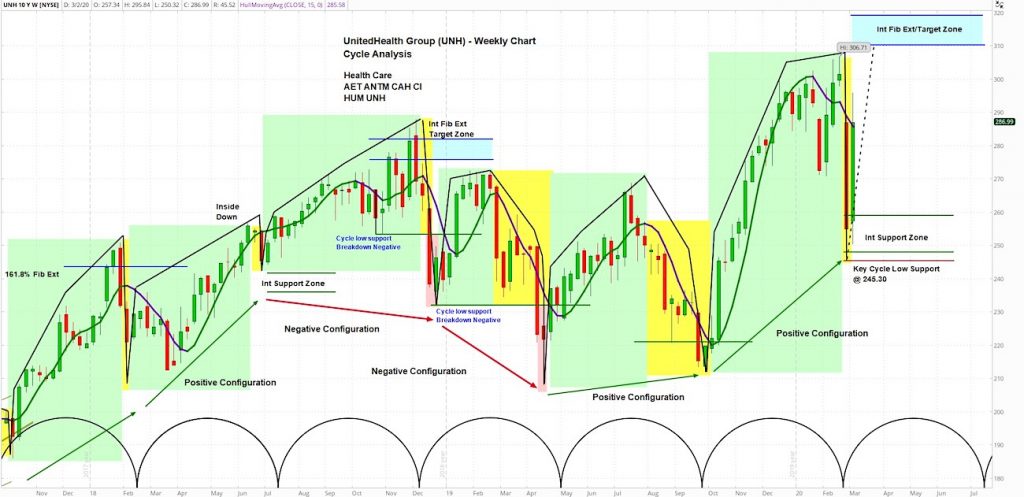
UnitedHealth Group (UNH) Weekly Chart
At askSlim.com we use technical analysis to evaluate price charts of stocks, futures, and ETF’s. We use a combination of cycle, trend and momentum chart studies, on multiple timeframes, to present a “sum of the evidence” directional outlook in time and price.
askSlim Technical Briefing:
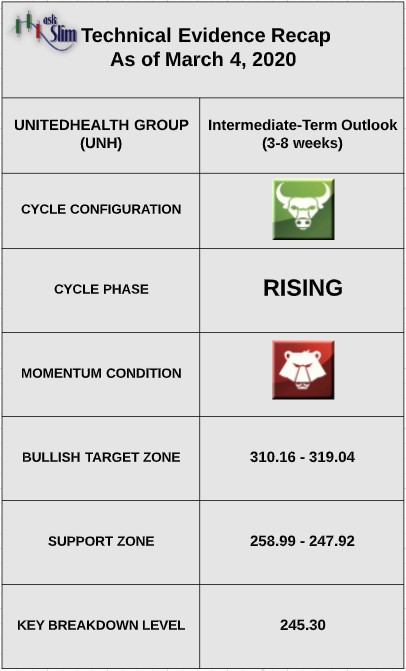
The weekly cycle analysis suggests that UNH is in a positive intermediate-term pattern. Weekly momentum, as of 3/4/2020, remains negative.
On the upside, there is an intermediate-term Fibonacci extension zone from 310.16 – 319.04. On the downside, there an intermediate-term Fibonacci support zone from 258.99 – 247.92. Our analysis suggests that for the bears to regain control of the intermediate-term, we would likely need to see a weekly close below cycle low support at 245.30.
askSlim Sum of the Evidence
UNH has a positive weekly cycle pattern with negative momentum that appears primed to turn up. Given these conditions, we would expect any sell offs to be limited to the intermediate-term Fibonacci supports beginning at 258.99. There is a likelihood that the stock tests the intermediate-term Fibonacci projection zone beginning at 310.16 by May.
Interested in askSlim?
Get professional grade technical analysis, trader education and trade planning tools at askSlim.com. Write to matt@askslim.com and mention See It Market in your email for special askSlim membership trial offers!
Twitter: @askslim
Any opinions expressed herein are solely those of the author, and do not in any way represent the views or opinions of any other person or entity.

: Worrisome to Broader Market?")
