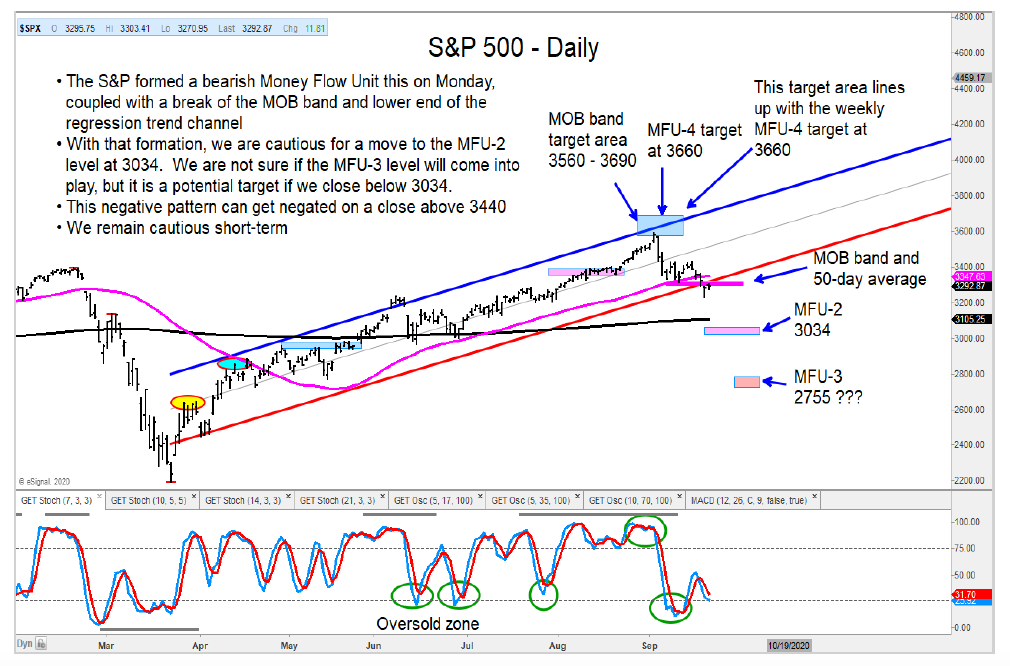
As I mentioned in my September 22 research post, the S&P 500 Index formed a negative Money Flow Unit (MFU) this week. This is a signal of weakness and a warning to the broader stock market in the days/weeks ahead.
Today, I will take a quick look at the stock market correction and highlight key stock market indices and ETFs.
The S&P 500 needs to clear its recent high at 3440 to negate the recent sell signal. Stock market correction targets have been generated with the first residing at 3034.
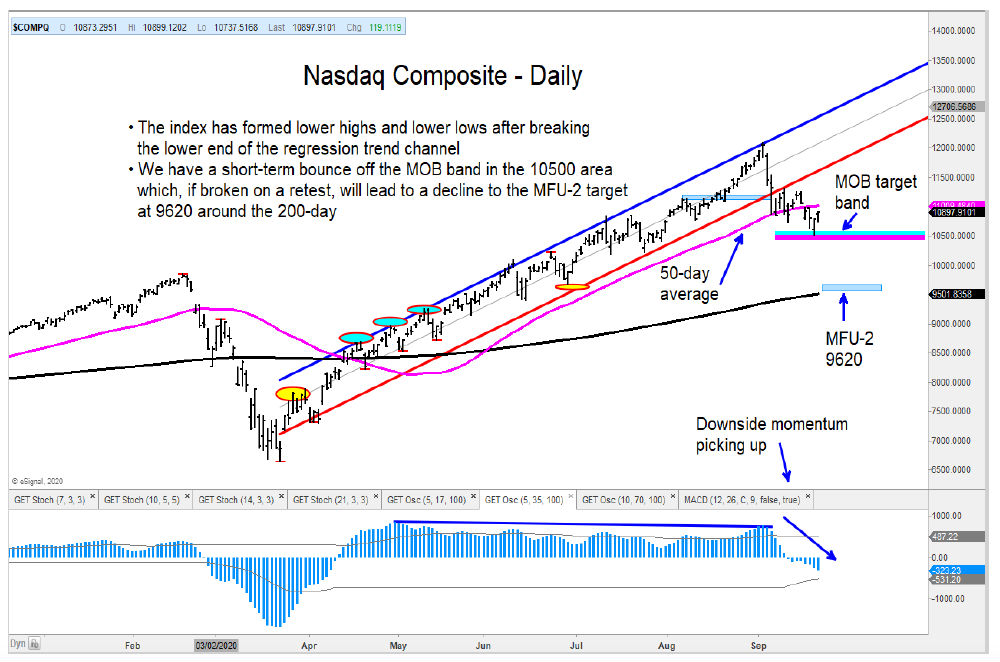
The Nasdaq Composite has broken below the 50-day moving average and is now bouncing off a MOB target band. A close below that band would be negative and will likely lead to a move towards the 200-day average. The Nasdaq would have to have a strong rally from here to cancel that viewpoint.
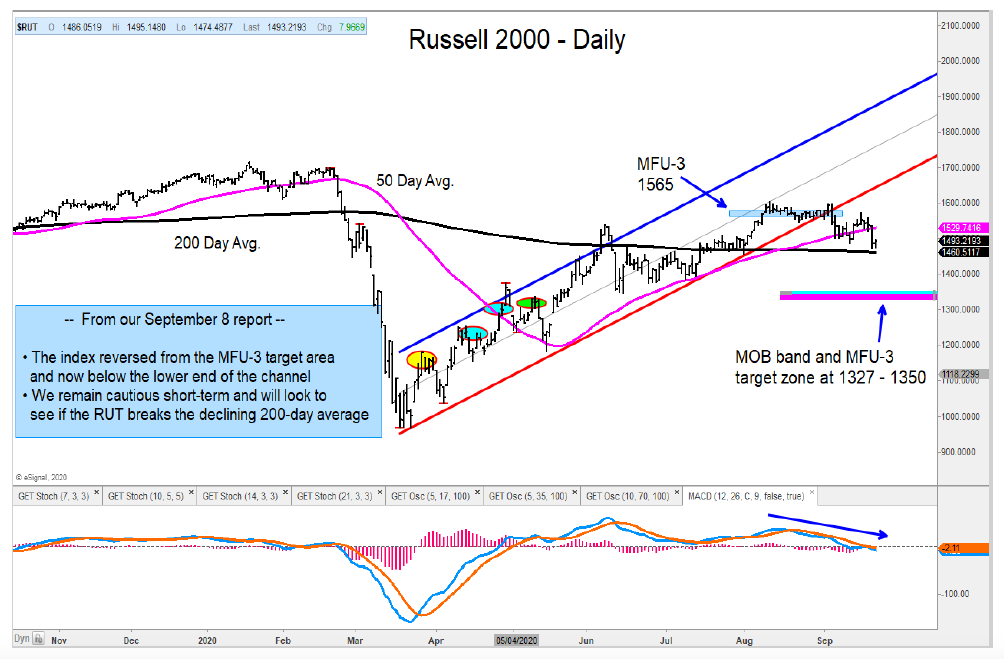
I also remain cautious the Russell 2000 Index and Mid-Cap Index. Smaller cap stocks are underperforming yet again, a key theme for 2020.
The Dow Transports continue to stall at a key Money Flow Unit target zone (MFU-3), which lines up with the 2019 highs.
Lastly, the Dow Jones Utilities remain in a weak position, along with the 20+ Year US Treasury Bond ETF (TLT) – I remain short.
The author may have a position in the mentioned securities at the time of publication. Any opinions expressed herein are solely those of the author, and do not in any way represent the views or opinions of any other person or entity.
: Creating Bullish Divergence?")


 and Semiconductors (SMH): Concerning Price Pattern?")


