S&P 500 Index Futures Trading Chart (September 21, 2020)
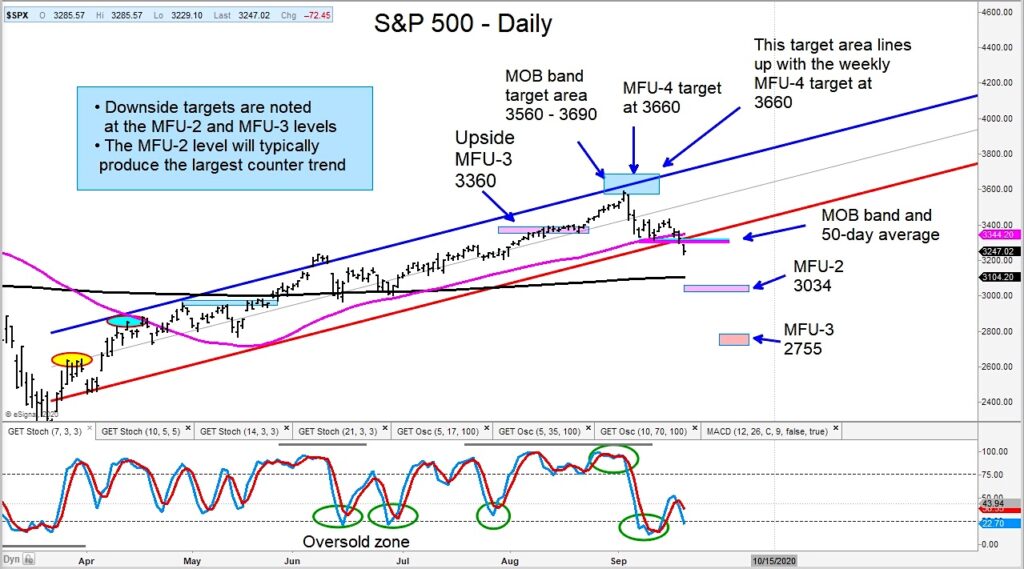
As I noted in my September 20 report to clients, “if we see weakness that breaks below the MOB band and 50-day average, the pullback could be deeper towards the 200-day average.”
That weakness emerged to break through these zones. As such, a bearish Money Flow Unit (MFU) has developed.
An MFU-4 price target (near the recent top) tends to be the terminal of a move and is confirmed with the formation of a negative MFU, which we have now.
The downside Money Flow Units are on the today’s chart. A bounce may be in order, but careful here.
The concern we have had for some time is the potential of the S&P 500 Index forming a top as it did in February and early March of this year. Similarly, that top received a negative MFU confirmation.
The author may have a position in the mentioned securities at the time of publication. Any opinions expressed herein are solely those of the author, and do not in any way represent the views or opinions of any other person or entity.


