Volatility reverberations hit the major stock market averages this week causing choppy trade for investors.
In today’s research note we’ll look at the S&P 500 technical backdrop, market breadth indicators, and investor sentiment for the week ending February 23, 2018.
Key Takeaways: A near-term trading range has emerged, with the S&P 500 testing resistance at its 50-day average. The lack of broad market improvement suggests near-term caution remains warranted. Weekly sentiment indicators are not showing pessimism (even as optimism has waned) and shorter-term sentiment indicators suggest near-term pessimism has ebbed.
S&P 500 Index
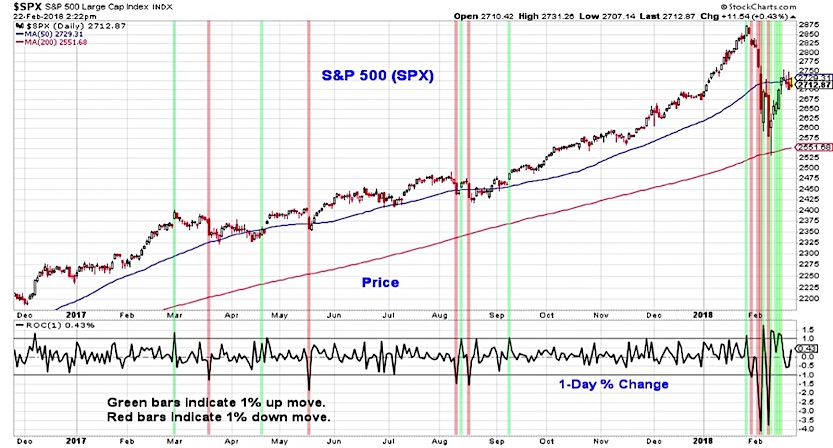
The rally off of the early February lows has yet provide strong evidence that it is sufficiently strong to produce sustained follow through. Following last week’s sustained move higher, the S&P 500 has slipped into a near-term trading range – testing resistance near 2750 and finding support near 2700.
The surge in short-term momentum that accompanied the rally off of the February lows has dissipated. Strong evidence of improving broad market momentum has yet to emerge. It is possible that a break above 2750 could clear the way for a strong and broadly-based move toward the January highs. It is also possible that a failure to do so could be seen as prelude to a full re-test of the February lows. A third possibility is that the recent surge in volatility (as measured by daily moves of 1% or more) persists but the S&P 500 continues to muddle within its current trading range (say between 2650 and 2750). That may be the outcome that would catch the most investors off guard. While near-term breadth has not given an all-clear signal to support a sustained move higher, it may have stabilized enough in to provide some degree of continued support.
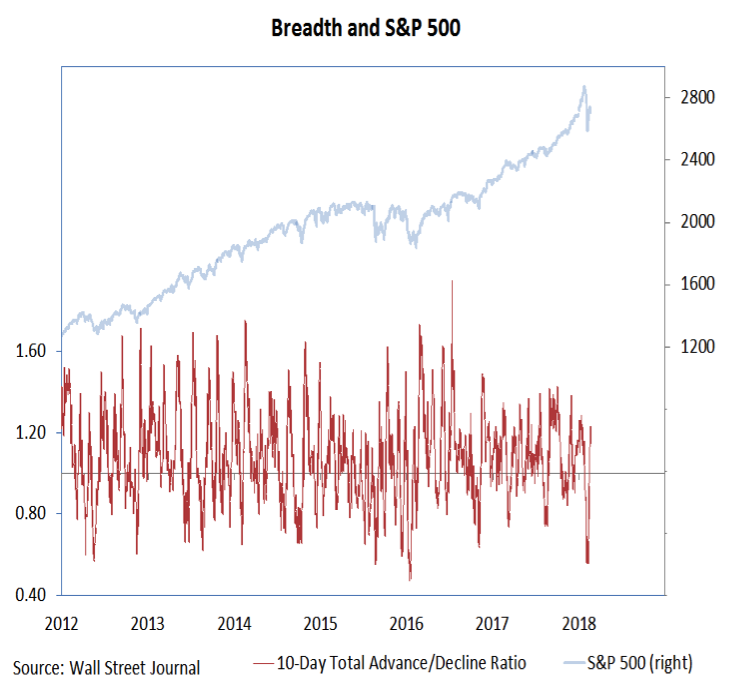
We continue to watch for two broad market developments that would suggest downside momentum has been broken (two or more days with upside volume outpacing downside volume by better than 9-to-1) and the upside momentum is building (advancing issues outnumbering declining issues by nearly 2-to-1 over a 10-day period). Neither of these have emerged as yet. We have seen some near-term breadth improvement, but it has fallen short of the breadth thrust threshold. After a relatively quiet 2017, volatility has reemerged in 2018. From a breadth perspective, however, it has only been on the downside (the recent drop in the 10-day advance/decline ratio is comparable to what was seen in later 2015/early 2016).
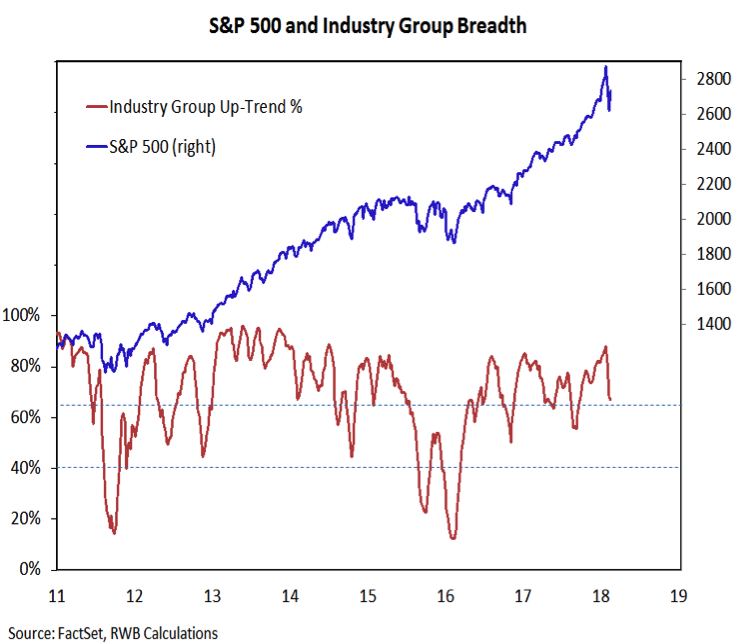
Even though the S&P 500 has moved off of its recent lows, we have yet to see our industry group trend indicator turn higher. This keeps us on alert that the snapback in the S&P 500 is not coming with the type of underlying improvement that could help fuel further gains. A break below the late-2017 trough in this indicator (near 55%) would be evidence that broad market conditions are not only not stabilizing, but have deteriorated further.
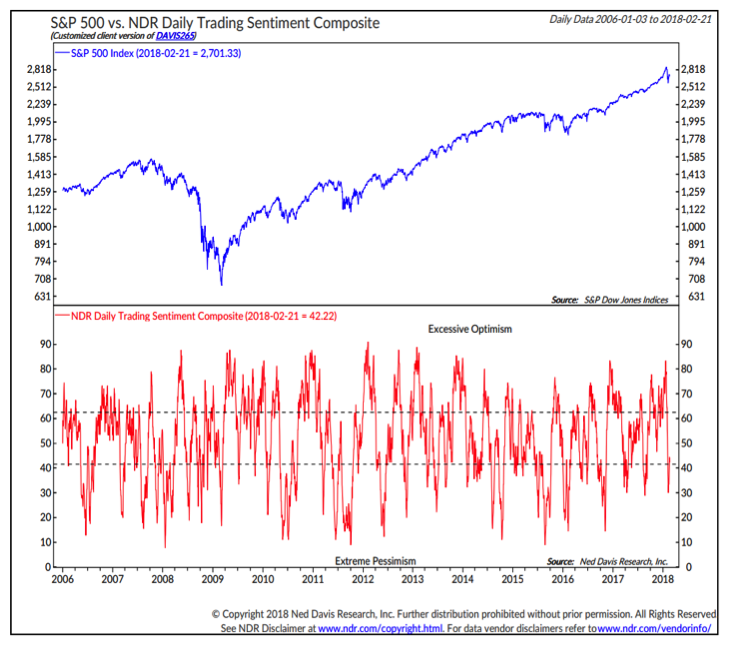
Weekly sentiment surveys have shown some easing in the excessive levels of optimism that were widespread in January, but a meaningful build in pessimism remains elusive (the speed and degree of last week’s snap-back rally in the S&P 500 may be keeping many from turning too cautious). This week’s Investors Intelligence survey shows only 14% bears and the AAII survey of individual investors shows twice as many bulls as bears. Median exposure on the NAAIM survey is still elevated at 85%. The build in pessimism on the shorter-term surveys that helped fuel last week’s move is being unwound. The NDR Trading Sentiment Composite moved from excessive pessimism back to neutral this week.
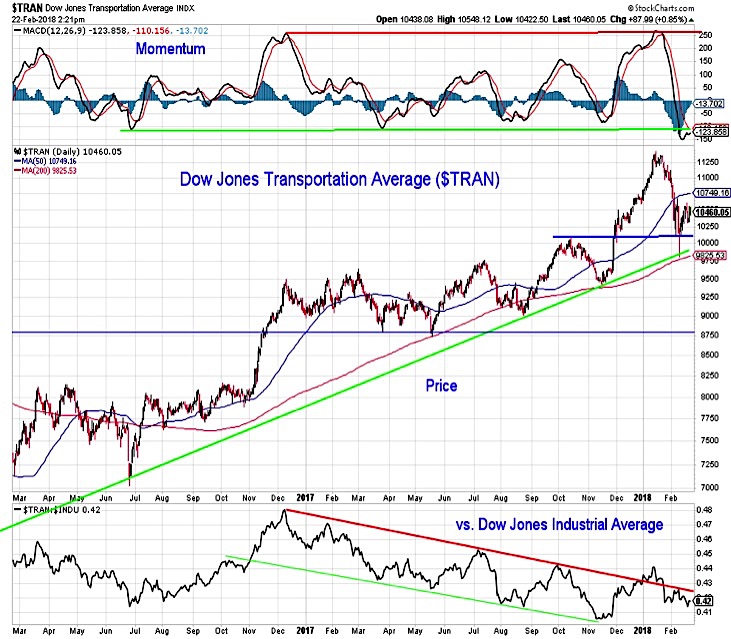
In last week’s market commentary (Watch For Evidence That Rally Is Sustainable) we highlighted the strength and leadership from the broker/dealer index as a reason for some near-term optimism in stocks. This week brings an “on the other hand” in the form the Dow Transports. While the Transports have bounced off of support, they have yet to engage their 50-day average, momentum remains poor, and the Transports are lagging relative to the Industrials.
Thanks for reading.
Twitter: @WillieDelwiche
Any opinions expressed herein are solely those of the author, and do not in any way represent the views or opinions of any other person or entity.


: Showing Some Signs of Emerging Strength")
