The Dow Jones is 1000 points higher than last Friday’s close and 1800 points higher than last Friday’s lows. All that in one week!
Now investors need to look for clues to see if this rally is sustainable. In today’s research note we’ll look at the S&P 500 technical, market breadth, and investor sentiment, all with an eye on gauging the latest rally.
Key Takeaways: Stocks have rallied in the wake of last week’s tumult. While the indexes have posted strong gains, we are still waiting for evidence that the bounce is enjoying broad support and upside momentum is returning. Short-term sentiment has moved to excessive pessimism, but there are signs that investor concern is quickly waning. Strength from the broker/dealer index offers a positive message for stocks overall.
S&P 500 Index
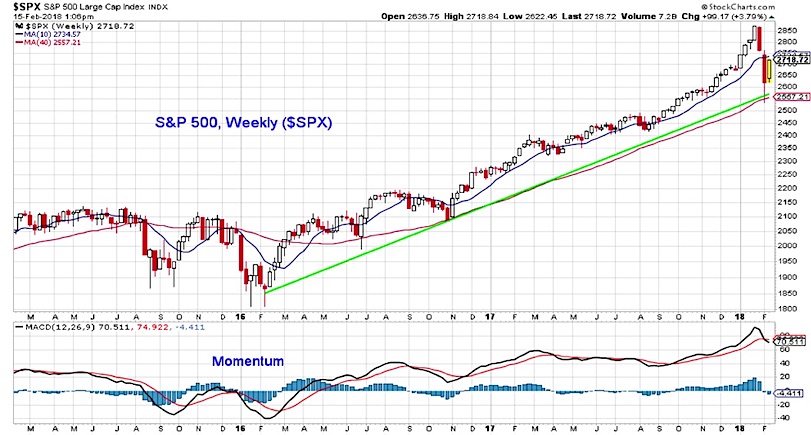
Last week’s selling petered out with the S&P 500 testing its 40-week average (which coincided with the rising trend line off of the early-2016 lows).
As selling pressure yielded to this week’s rally, the S&P 500 has climbed back toward its 10-week average (shown on the chart below) and its 50-day average (near 2720). This move has come with improving short-term momentum and a break above the short-term trend line off of the January highs; the weekly chart suggests that momentum continues to contract. This could open the door for further near-term rally attempts – after resistance in the 2720-2735 range, the next level of resistance could be near 2760. It is too early to conclude that the longer backdrop has improved and that a sustained rally is emerging. More likely from our perspective, is a period of broad consolidation. This is consistent with the current message from the overall weight of the evidence (Evidence Shifts To Neutral As Market Factors Deteriorate). The size of the moves seen over the past two weeks may be mostly indicative of the return of more historically normal level of volatility.
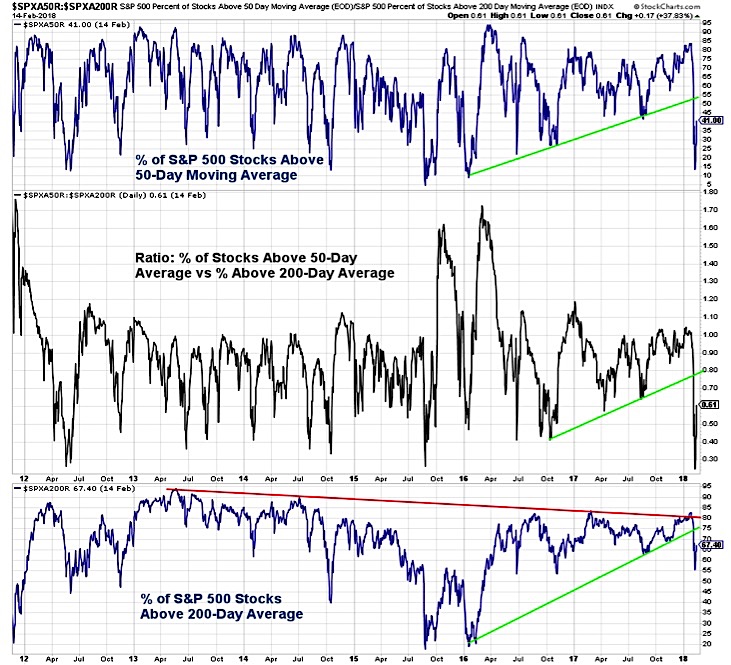
To gain confidence that the bounce being seen at the index level has legs, we are looking for improving trends at the individual stock level and evidence of meaningful buying pressure. Both the percentage of stocks above their 50-day average and percentage above their 200-day average broke down last week. The ratio between the two plummeted to a level that suggests stocks were extremely oversold on a short-term basis. While they have bounced this week, there is further work to be done to support the view that the index-level bounce is enjoying broad support. Only two-thirds of stocks in the S&P 500 are trading above their 200-day averages (the percentage is lower for mid-caps and small-caps) and less than half are above their 50-day averages.
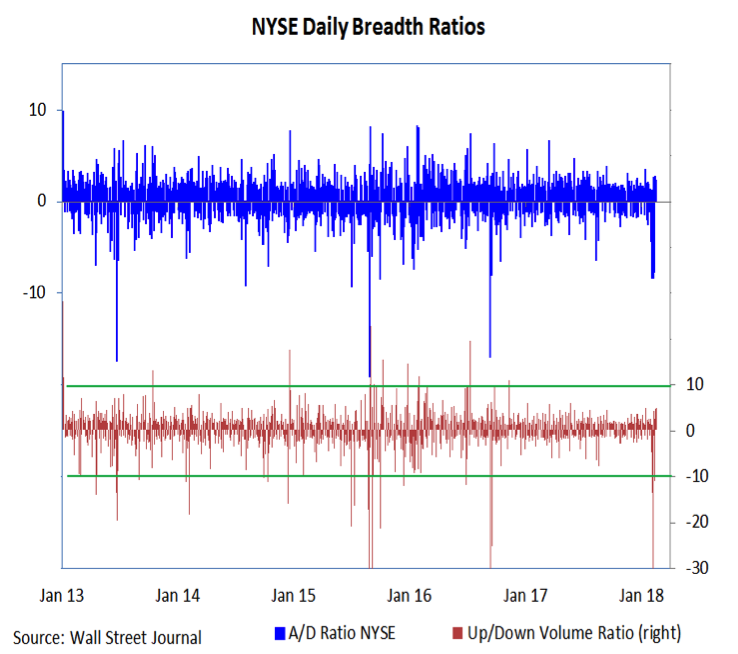
During the sell-off from the January highs, the NYSE experienced multiple days on which downside volume exceed upside volume by better than nine-to-one. While the S&P 500 has added more than 100 points this week and has rallied for five straight days, we have yet to see meaningful buying pressure emerge in terms of upside volume versus downside volume. The best that has been seen is five-to-one. Two or more days of nine-to-one upside over downside volume would be strong evidence that downside momentum has been broken and could clear the way for an upside breadth thrust (the last of which was seen in November 2016).
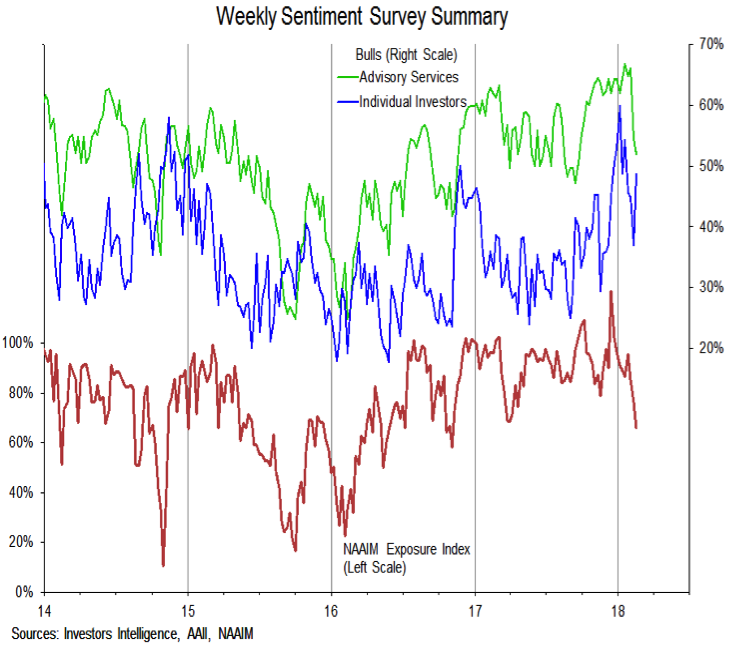
Short-term sentiment indicators show that investor optimism has been replaced with pessimism. Demand for puts has remained elevated this week even as stocks have rallied (the 10-day CBOE put/call ratio has moved above 100% for the first time in nearly a year). The weekly sentiment surveys have also shown evidence that optimism is waning. The NAAIM exposure index is at its lowest since November 2016 and Investors Intelligence bulls are 15 points below their peak. These surveys, however, also give some hints that investor concern may be short-lived. Bears on the Investors Intelligence survey dropped this week (to 14%) and the AAII survey showed both a surge in bulls and collapse in bears. A quick return to optimism may limit near-term upside for stocks.
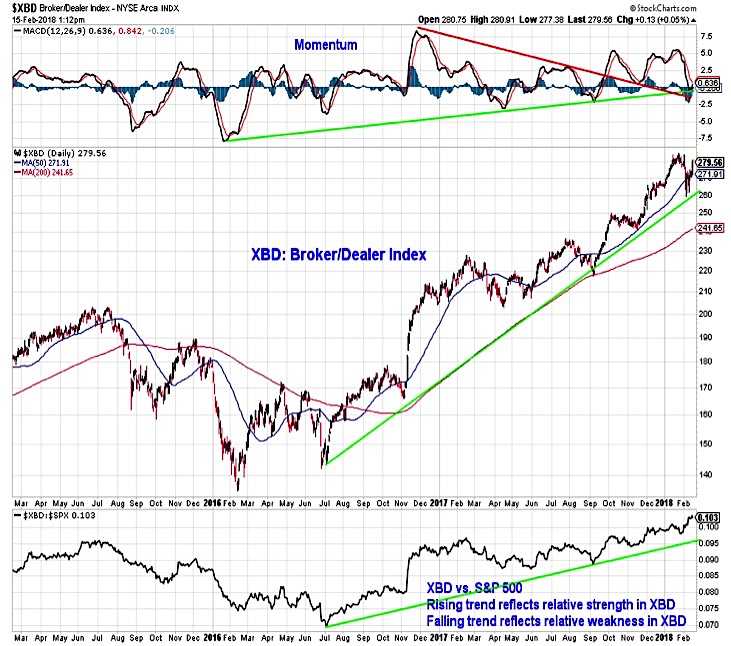
In contrast to the concerns about the sustainability of the current bounce, leadership from the broker/dealer index (which has moved to a new high relative to the S&P 500) is typically bullish for stocks overall. A new absolute price high and a turn higher in momentum (which has pulled back to trendline support) would advance the bullish case for stocks.
Thanks for reading.
Twitter: @WillieDelwiche
Any opinions expressed herein are solely those of the author, and do not in any way represent the views or opinions of any other person or entity.


: Showing Some Signs of Emerging Strength")
