The equity markets suffered the steepest decline in 26 months last week.
The weakness was attributed mainly to investors’ fear of a trade war with China. Last week the President made good on a campaign promise of imposing new tariffs of $60 billion on products from China to punish China for a pattern of economic aggression that has robbed American companies of billions of dollars in profits.
China responded with plans to impose tariffs of $3 billion on U.S. exports. There may certainly be disruptions in supply chains across many countries. However, every trade deal is negotiated. The details of the tariff on Chinese goods have not yet been announced. It is too early to predict the possibility of a full-blown trade war and it seems unlikely given that the U.S. is China’s largest market.
Additionally, the stock market’s technical condition deteriorated since the January highs and this also likely played a role in the March draw-down. The late-January/early-February correction produced a momentum shift marked by four sessions when downside volume exceeded upside volume by a ratio of 9 to 1 or more. The momentum factor needs to be reversed to feel confident that the downside turmoil has run its course.
Entering the new week, some positive technical developments have surfaced that suggest a short-term low could be close. We are encouraged by the fact that the new 2018 closing low was confined to the Dow Industrials, S&P 500 Index and the NY Composite. The Russell 2000, S&P Mid-Cap, NASDAQ Composite and Dow Transports failed to make new closing lows. This resulted in some positive divergences that often signal a market bottom is near.
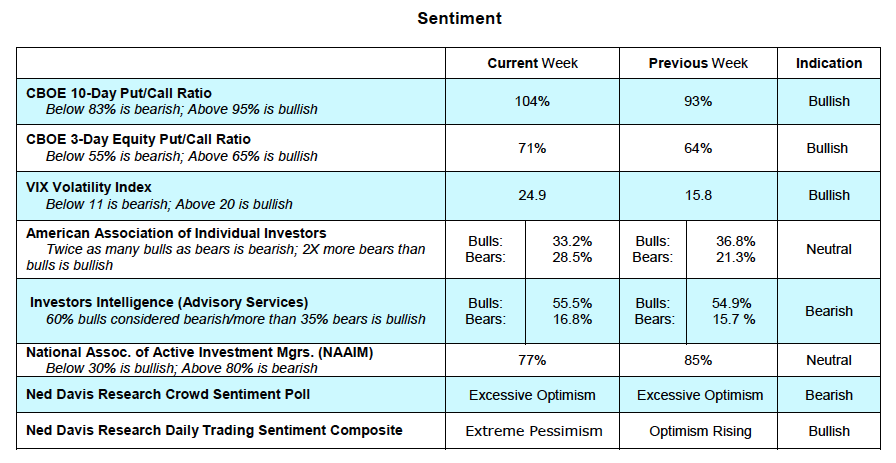
Additionally, the number of issues hitting new 52-week lows failed to expand beyond what was seen at the February low. Historically, an expansion in the number of issues hitting new 52-week lows is a warning that the decline is poised to continue. Last week’s sharp drop in the averages helped produce an oversold condition. Only 16% of S&P 500 stocks are now trading above their 50-day moving average. We are also encouraged by the fact that investor optimism has faded and is being replaced with pessimism. This is measured by the unusually strong demand for puts. The CBOE reported the put/call ratio was 150% on Friday, the highest in nearly three years. This could be significant as options traders have a very poor record at important turning points in the market. Other signs that pessimism is nearing an extreme include the jump in the CBOE Volatility Index and nearly $20 billion exiting stock funds last week.
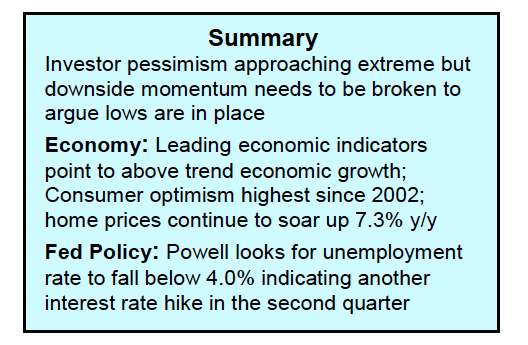
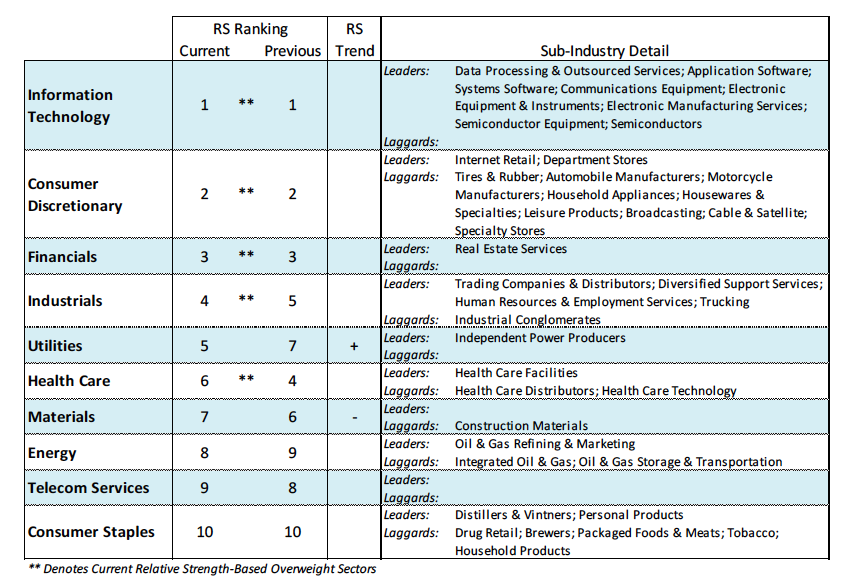
Looking further out, the Conference Board’s Leading Economic Index (LEI) improved for the fifth consecutive month suggesting the outlook for growth has strengthened. This is important given that corporate buybacks are expected to accelerate by 50% this year compared to 2017 due in part to strong corporate cash flow. Despite the good news on the economy and corporate earnings, we are waiting for the technical indicators to signal the path of least resistance has resumed to the upside. Once market breadth improves and the downside momentum is broken, investors should focus on areas of the market exhibiting the strongest relative strength. This would include the financials, health care and the industrials sectors within the S&P 500 Index.
Thanks for reading.
Twitter: @WillieDelwiche
Any opinions expressed herein are solely those of the author, and do not in any way represent the views or opinions of any other person or entity.


: Creating Bullish Divergence?")


