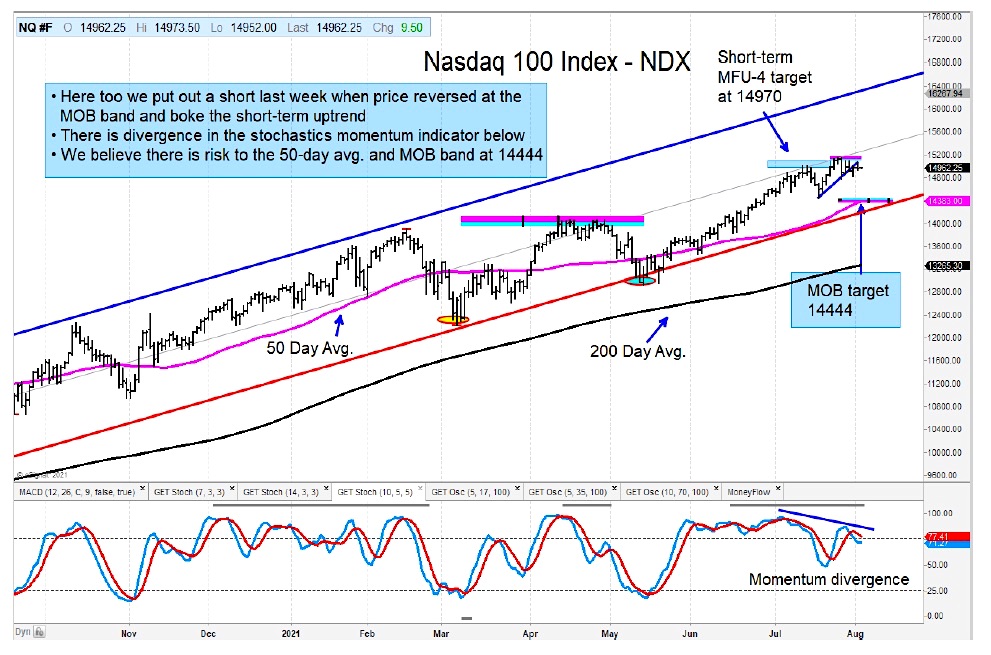
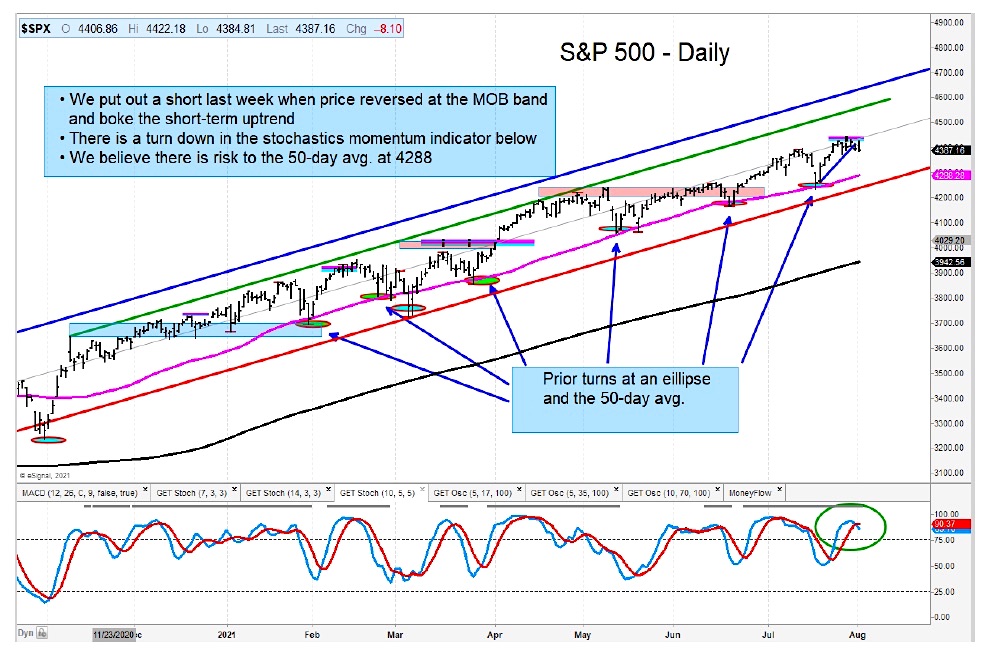
The S&P 500 and NASDAQ 100 Indexes both reversed at important MOB band trading price targets. They also broke very short-term up-trends.
This prompted me to turn bearish.
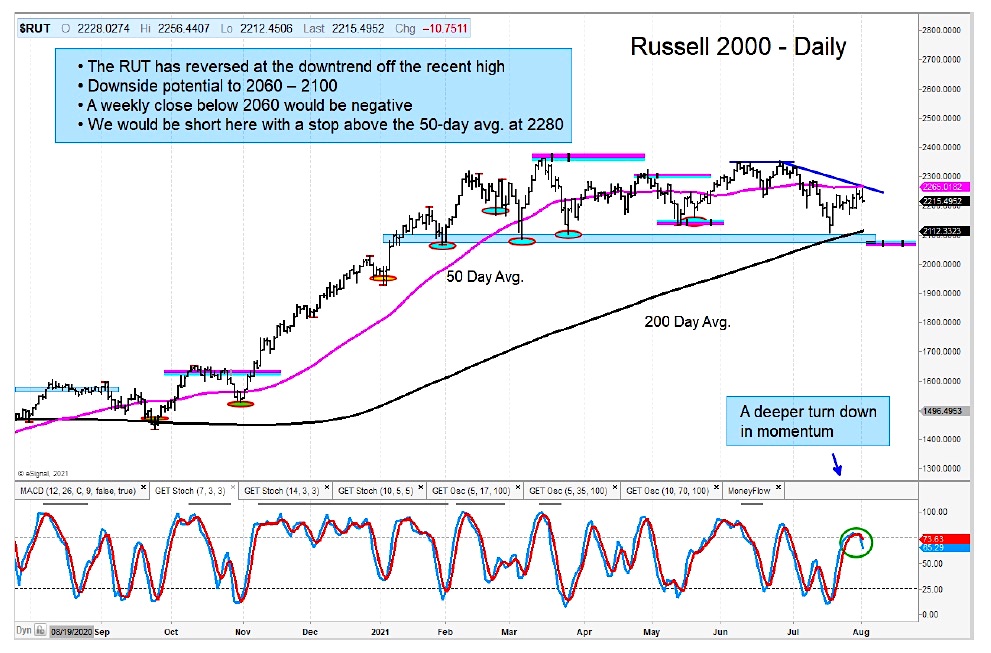
The Russell 2000 Index also reversed from an important resistance zone while seeing its momentum turn down. This is another short opportunity (using a stop just above the 50-day moving average).
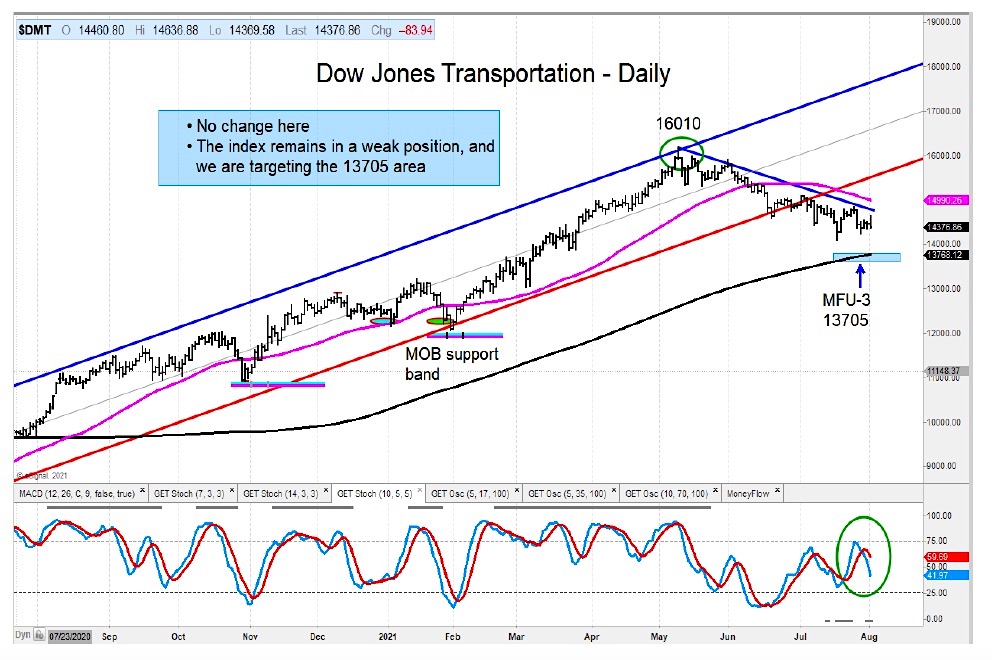
This “cautious” theme continues as we look at other major sectors and indices, with the Dow Jones Transportation Average mired in a 3 month down-trend and looking to head lower yet.
The iShares Software Sector ETF (IGV) has also stalled out at a long-term MOB band price target. I am on alert for a possible breakdown for this key ETF.
The Energy Sector ETF (XLE) also triggered a sell signal as it reversed from a key resistance zone and broke its short term up-trend.
On a positive note, the Semiconductors ETF remains within its up-trend channel, so we may see a bit more strength before stalling.
More supporting investment research charts:
The author or his firm have a position in mentioned securities at the time of publication. Any opinions expressed herein are solely those of the author, and do not in any way represent the views or opinions of any other person or entity.


