The stock market broke out of a two-week losing streak last week with the S&P 500 Index (INDEXCBOE:.INX) gaining 1.5%.
Stocks have been locked in a trading range for several months on fears of trade wars offset by continued strength in the U.S. economy that is gaining momentum.
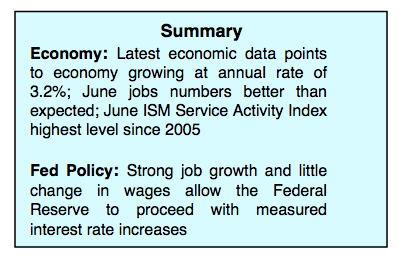
Friday’s employment report showed nonfarm payrolls growing faster than forecast. More importantly, the Labor Department reported that the work force expanded by 600,000. Wage growth was held in check, in part because of the increase in the labor pool, which is seen as a positive as it likely keeps the Fed on a measured path in monetary policy.
The markets also appeared less concerned over the flattening of the yield curve with the yield difference between the 2-year and 10-year note falling to the lowest level since 2007. The contraction in the yield curve is likely the result of lowered inflation expectations and the plunge in overseas returns than a reflection of future economic activity.
The latest jobs numbers and the best ISM data for the service sector since 2005 argues that GDP growth is solidly on track for annualized gains of 3.00% or more. The bottom line is that the strongest support for the stock market remains the strength of the U.S. economy. This argues that any potential drawdowns this summer associated with the mid-term elections will be minimal and reversed later in the year.
Defensive sectors including utilities, consumer staples, REITs and health care continue to gain in relative strength. The transition to defensive areas, according to Ned Davis Research, is typical of what is seen in the summer months preceding mid-term elections.
The technical indicators argue for a continuation of the trading range that has been in effect since the February lows. Investor sentiment indicators improved significantly the past two weeks suggesting over the near term stocks are likely to improve on last week’s gains. The shift in investor psychology is seen in the reversal by the Ned Davis Daily Trading Sentiment Composite that has moved from excessive optimism three weeks ago to excessive pessimism on Friday’s close.

Stock market breadth, however, remains problematic. Since the February lows, the stock market has become increasingly dependent on the technology sector for overall performance. Within the tech sector a small percentage of stocks are responsible for most of the gains for the S&P 500 Index this year. The majority of S&P sectors are either down or flat for the year. We are also concerned by the performance of the financial sector given the historical record as a leading indicator of the overall market. The fact that the financial sector is down for the year with many leading banks trading below their 50- and 200-day moving averages suggests a cautious approach. Additionally, within the financials sector, the broker-dealer group, which also has leading tendencies, is in the red for the year.
Twitter: @WillieDelwiche
Any opinions expressed herein are solely those of the author, and do not in any way represent the views or opinions of any other person or entity.


