Let’s start with a summary of the USDA’s July 2016 WASDE Report for Corn. I’ll look at the data, implications on december corn futures CZ6 and related ETFs (NYSEARCA:CORN). I’ll then look deeper at current fundamentals before diving into the corn futures price outlook.
Let’s get started.
U.S. Corn – The USDA made only minor adjustments to the 2016/17 U.S. Corn balance sheet. Planted acreage was raised to 94.1 million acres, which was known in advance following the USDA’s June 30th Acreage report. The corn yield was left unchanged versus June at 168 bushels per acre. Total production improved to 14,540 million bushels, up 110 million bushels versus June and 939 million bushels higher than a year ago. On the demand side of the ledger, feed and residual use was lowered 50 million bushels to 5,500 million with corn-ethanol demand down 25 million bushels (5,275 million versus 5,300 in June). Those decreases were offset by a 100 million bushel increase to exports, which were revised to 2,050 million bushels. The net impact on the 2016/17 U.S. corn carryout was a month-on-month increase of 73 million bushels with ending stocks now forecasted at 2,081 million bushels versus the average trade guess of 2,213 million.
Corn Market Implications: There were a couple of surprises in the report; however none of them will likely prove substantial enough to initiate a sizable paradigm shift in december corn futures prices (up or down) relative to where the market is currently trading. On the production side, several traders were mildly surprised the USDA left the yield unchanged given this year’s U.S. corn crop rating of 76% good-to-excellent, which is now equal to 2014. As I’ve mentioned in previous columns, 2014’s final record U.S. corn yield was 171 bpa. Therefore my assumption is the trade will now anticipate a yield increase in the August report, assuming corn condition ratings hold above 74% good-to-excellent into the first week of August. By comparison, in the August 2014 WASDE report, the USDA increased the U.S. corn yield 2.1 bpa. A 2 bpa increase in the August 2016 WASDE report would theoretical raise U.S. corn production another 182 million bushels versus the USDA’s July estimate.
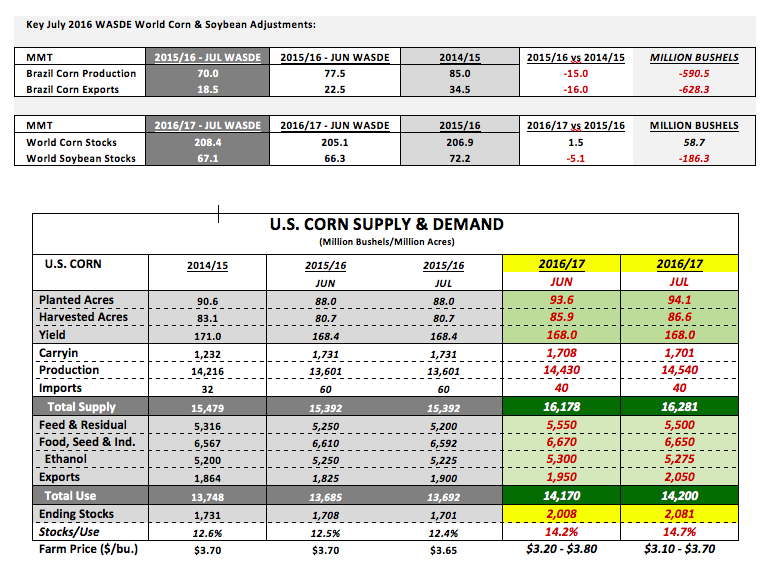
As far as demand is concerned, I’m not sure what to make of the USDA’s downward adjustment to 2016/17 U.S. corn-ethanol use, albeit just a 25 million bushel reduction versus a month ago. U.S. ethanol production has been running at a record clip while average industry ethanol margins continue to show positive returns through the 4th quarter of 2016 (even with a 10+ cents per gallon inversion in ethanol values, spot versus O/N/D). In fact during the month of June, U.S. ethanol production averaged a record 996,000 barrels per day. Gasoline demand remains strong. Therefore the USDA must be speculating that gasoline demand and/or U.S. ethanol exports will be lower by the time the 2016/17 crop year officially starts on September 1st, 2016. That said I currently don’t see the justification for any sort of decrease in 2016/17 U.S. corn-ethanol demand.
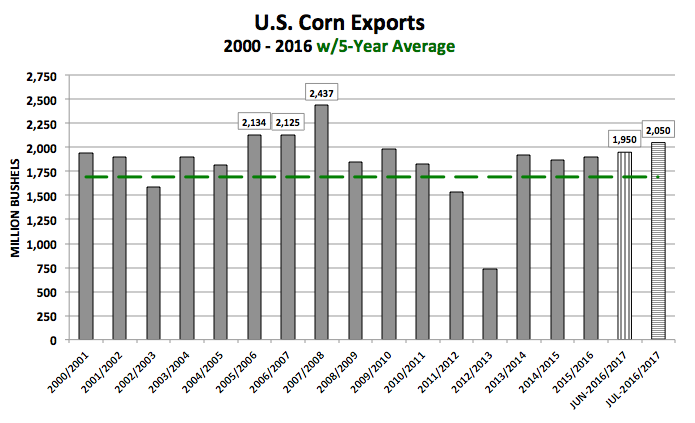
Regarding U.S. corn exports being raised to 2,050 million, the 100-million bushel increase to exports seems optimistic. However in light of the USDA lowering Brazil’s 2015/16 corn crop another 7.5 MMT in the July WASDE report, clearly the U.S. is now in a position to take advantage of Brazil’s smaller pool of available bushels for export in the world market. As a result, Brazil’s 2015/16 corn exports were lowered to 18.5 MMT versus 34.46 MMT in 2014/15, a decrease of 15.96 MMT or 628 million bushels. The U.S.’s primary export competition will now likely be Argentina. However, Argentina only produces 28 MMT or 1,100 million bushels of corn annually (2015/16). Therefore they don’t have the ability to export significantly more corn than they already intend to regardless of price and/or opportunity. All of those bodes well for a resurgence in U.S. corn exports back to levels the U.S. hasn’t experienced in 9 to 10-years.

Ultimately, 2016/17 U.S. corn ending stocks of 2,081 million bushels, although lower than the average trade guess, are still without question more than adequate and over time suggest the possibility of a retest of the 2014 December corn futures contract low of $3.19. That said I still believe it’s too early for corn futures to make that type of push lower with just 32% of the U.S. corn crop silking and still plenty of weather-related hurdles remaining prior to corn harvest this fall.
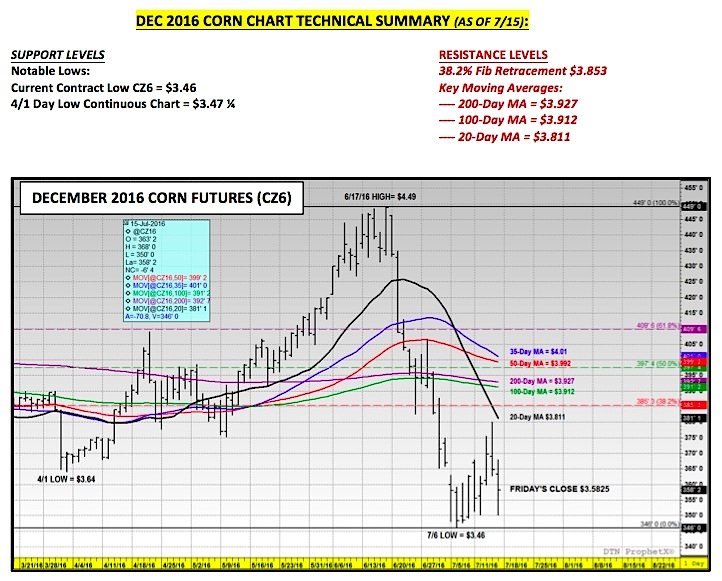
December Corn Futures Forward Price Outlook:
December corn futures closed down 4 ¼-cents per bushel week-on-week finishing on Friday at $3.58 ¼. The only real positive for Corn Bulls was CZ6 managing to avoid trading back down to last week’s new contract low of $3.46 on 7/6. The hope going forward for all remaining corn longs is that NOAA’s current 6 to 10-day forecast (see page 3) proves itself accurate come Monday morning. Weather models are presently suggesting sharply-above normal temperatures with below-normal precipitation for the bulk of the Corn Belt during the last half of July.
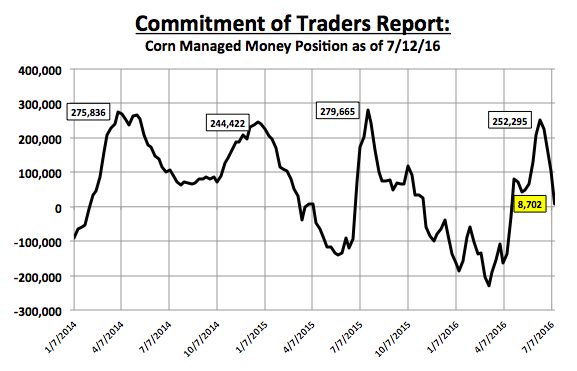
One other possible price support for Corn Bulls was this week’s Commitment of Traders report. It showed Money Managers essentially liquidating the remainder of their net long corn position. As of July 12th, the Managed Money long in corn had been reduced to just +8,702 contracts versus the June 14th calendar year high of +252,295 contracts.
The question now is, “Will the money shift to a net short position?”
I think it’s worth noting given 2016’s historical fundamental comparisons to both 2014 and 2015 (that being record to near record U.S. corn yield potential combined with surplus U.S. and World corn ending stocks), Money Managers still chose NOT to create a net short position in corn from July through October in either year even with an equally bearish forward view on corn futures prices similar to 2016. This would seem to suggest that the “money” still respects the possibility of a late growing season weather related issue trimming national corn yield prospects.
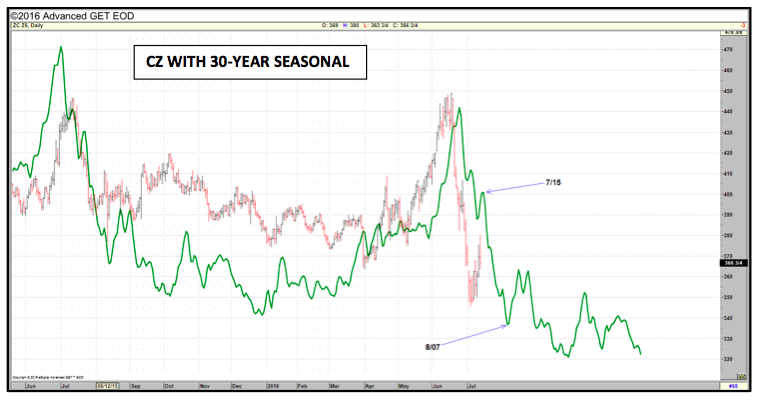
Overall however, until the market can see signs of the U.S. corn yield moving backward (via a reduction in corn’s good-to-excellent rating, which remains at a record clip) sustainable rallies should still prove very hard to manufacture. I still believe December corn futures are currently primed for more sideways/ range bound type price action for the next couple weeks ($3.50 to $3.80). I should note the 5, 10, and 30-year corn price seasonals all issued sell signals on 7/14 and 7/15, which has thus proved very accurate. That said I still believe aggressive sell-offs below the current CZ contract low of $3.46 will likely be reserved for the Sep/Oct timeframe (similar to 2014).
Thanks for reading.
Twitter: @MarcusLudtke
Author hedges corn futures and may have a position at the time of publication. Any opinions expressed herein are solely those of the author, and do not in any way represent the views or opinions of any other person or entity.
Data References:
- USDA United States Department of Ag
- EIA Energy Information Association
- NASS National Agricultural Statistics Service


