December corn futures are trading lower by 16 1/2 CENTS per bushel week-on-week vs last Thursday’s close.
Let’s review current news, data releases, and market trends with a look to the week ahead (September 14). We’ll also tackle the question: Are corn prices nearing a bottom?
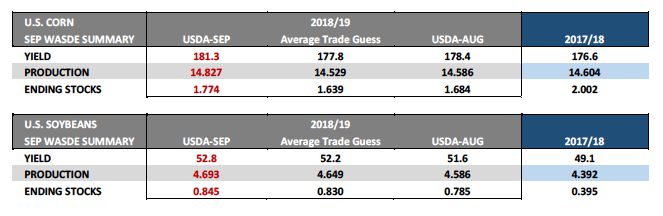
On Wednesday the USDA released its September 2018 WASDE report with traders keenly focused on what adjustments the USDA would make to their 2018/19 U.S. corn and soybean yield estimates.
Prior to the report the expectation was that the USDA would tangibly increase the 2018/19 U.S. soybean yield, which in fact they did raising it to 52.8 bpa, +0.6 bpa higher than the average trade guess and +1.2 bpa above the USDA’s August forecast. However the major surprise came in corn, where private opinions varied greatly going into the report with most anticipating a yield reduction versus a month ago. On the contrary the USDA increased its 2018/19 U.S. corn yield estimate to a new record high 181.3 bpa, +3.5 bpa higher than the average trade guess and +2.9 bpa above the USDA’s August forecast. I’ll put myself in the category of those not expecting a corn yield increase, let alone an increase of that magnitude (+1.6%).
What key corn states experienced yield increases versus a month ago?
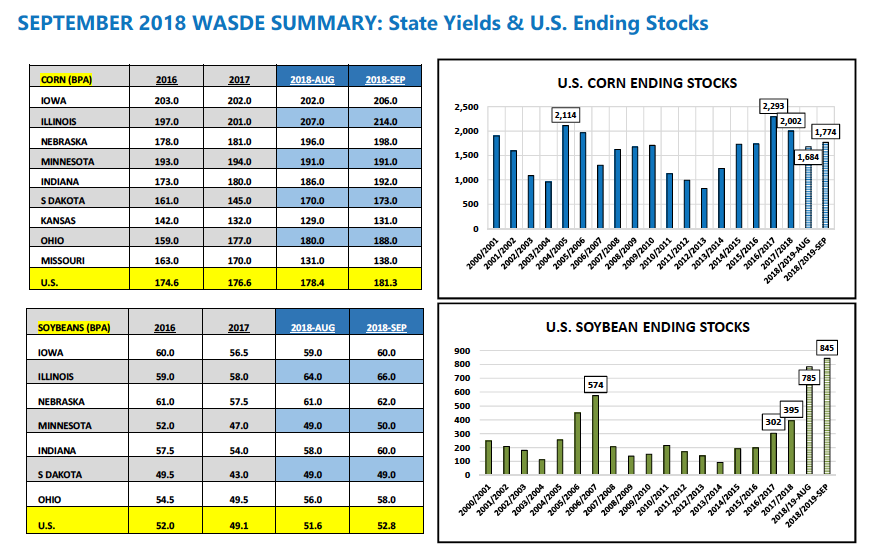
Nearly all of them; however none stood out more than Illinois, which saw its state corn yield raised to an almost unthinkable 214 bpa (+7 bpa higher than August and +13 bpa above its previous record high of 201 bpa). Iowa also had its state corn yield increased substantially improving to 206 bpa (+4 bpa higher than August and +3 bpa above its previous record high of 203 bpa).
Other states with notable yield increases were Nebraska +2 bpa to 198 bpa, Indiana +6 bpa to 192 bpa, Ohio +8 bpa to 188 bpa, South Dakota +3 bpa to 173 bpa, and Missouri +7 bpa to 138 bpa. Seemingly only Minnesota walked away from the September Crop report with a corn yield estimate unchanged versus a month at 191 bpa.
How accurate is the USDA’s September U.S. corn yield estimate? If you are a Corn Bull you’re hoping 2018/19 plays out like 2010/11.
In 2009/10 the U.S. achieved what was at that time a record corn yield of 164.4 bpa. The following crop year the USDA, likely influenced by the impressive yield results from the previous growing season, substantially over-estimated the 2010/11 U.S. corn yield in the September 2010 WASDE report. That September the USDA issued a 2010/11 U.S. corn yield estimate of 162.5 bpa only to see that yield figure reduced nearly 10 bpa by January to 152.6 bpa.
Therefore is it possible the USDA could be vastly over-estimating the 2018/19 U.S. corn yield in the September Crop report?
YES. HOWEVER from a trader’s point of view, the contrarian argument should also be considered, which says over the past 6 crop years (since 2012/13) only 1 time has the USDA lowered the U.S. corn yield from September to January. Furthermore that lone decrease occurred in 2014/15 and represented a yield decline of just -0.7 bpa. That said this is a debate that likely won’t be settled for the 2018/19 U.S. corn crop until after this year’s harvest.
What’s the lasting impact of the September WASDE report on corn futures?
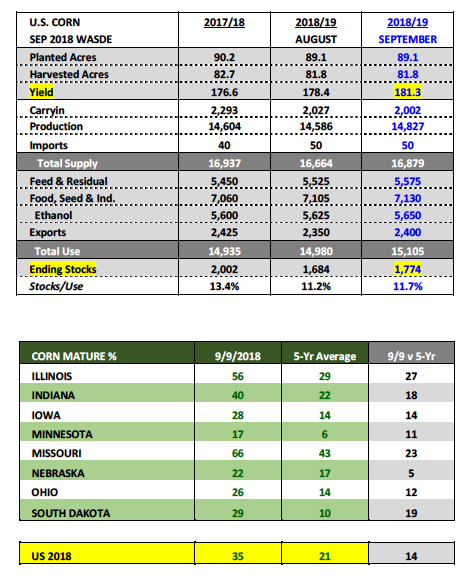
For me it’s the fact that even with a record U.S. corn yield of 181.3 bpa, 2018/19 U.S. corn ending stocks are still projected to decline 228 million bushels versus a year ago (1.774 billion bushels versus 2.002 billion bushels in 2017/18). Additionally WORLD corn stocks are forecasted to drop 37.1 MMT or 19.1% versus 2017/18 (157.03 MMT versus 194.15 MMT). This speaks to the continued strong demand for corn, as well as, an implied need longer-term for consistent, above-trend corn yields to satisfy what is growing WORLD demand. That said I’m not sure this report will be viewed as “Bearish” over time as Wednesday’s 14 ¼-cent lower close might otherwise indicate.
DECEMBER CORN FUTURES TRADING OUTLOOK
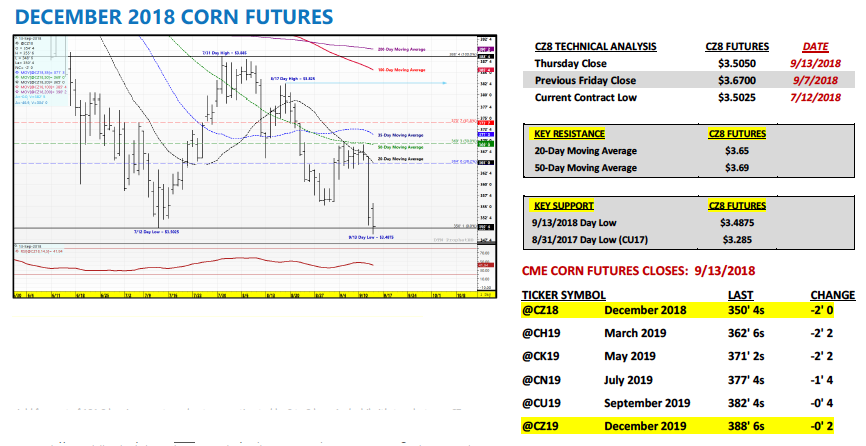
Wednesday’s unexpected U.S. corn yield increase of +2.9 bpa sent corn futures spiraling lower. As a result December corn futures established a new contract low on Thursday of $3.48 ¾.
That said…just how “Bearish” is the USDA’s revised 2018/19 U.S. corn carryout estimate of 1.774 billion bushels with December corn futures currently trading at approximately $3.50 per bushel?
I might be in the minority, however to put it plainly, I wouldn’t be establishing new shorts at or below $3.50 with U.S. corn ending stocks 374 million bushels below the prior 2-year average. Not to mention that’s assuming the USDA’s September yield forecast of 181.3 bpa is accurate and not over-estimated by 2 to 3 bpa. And while it’s true last year CZ eventually drifted below $3.40 per bushel during the month of November, it’s important to note that specific sell-off was a byproduct of the September 2017WASDE report, in which 2017/18 U.S. corn ending stocks were projected at 2.335 billion bushels.
Furthermore in the October 2017WASDE report U.S. corn stocks increased yet again to 2.340 billion bushels. Therefore we’re talking about to very different U.S. corn S&D tables and ending stocks projections with very different price implications. That said once the market gets past its initial reaction to Wednesday’s yield increase I believe the demand story, which continues to impress, will start to provide more and more underlying price support. All of this isn’t to suggest that CZ18 couldn’t momentarily dip down to $3.44 to $3.46 short-term; however I don’t expect it to say there or linger at consistently depressed values as it did in 2017.
Two key price supports moving forward are:
- In the September WASDE report the USDA increased 2018/19 U.S. corn demand to a new record high of 15.105 billion bushels. All 3 major demand sectors saw increases including Feed & Residual Use, Ethanol & by-products, and Exports. No one’s talking about this…yet.
- Also in the September WASDE report…2018/19 WORLD corn ending stocks were forecasted to drop 37.1 MMT or 19.1% versus 2017/18 (157.03 MMT versus 194.15 MMT).That’s a significant one-year swing in stocks and one that warrants sizable attention heading into 2019/20. That can’t happen again.
I’ve been saying it for a couple weeks now; however I still want to own corn on a significant break. That said I believe we’re approaching price levels that represent value. Therefore I’m viewing the September WASDE report as a trading opportunity…
Twitter: @MarcusLudtke
Author hedges corn futures and may have a position at the time of publication. Any opinions expressed herein are solely those of the author, and do not in any way represent the views or opinions of any other person or entity.
Data References:
- USDA United States Department of Ag
- EIA Energy Information Association
- NASS National Agricultural Statistics Service

: Worrisome to Broader Market?")


