December corn futures closed up 2 CENTS per bushel week-on-week, finishing at $3.67.
Let’s review current news, data releases, and market trends for the week ahead (September 10):
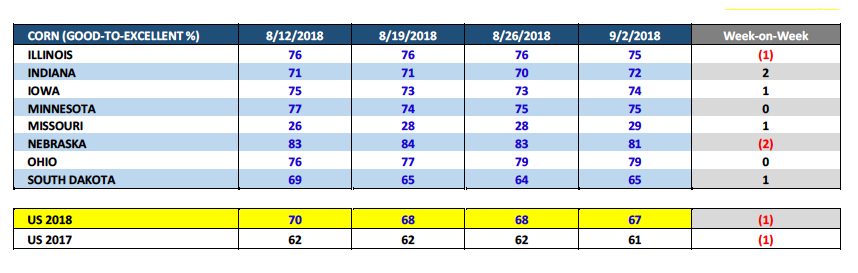
Tuesday’s Weekly Crop Progress report showed the U.S corn good-to-excellent rating down 1% week-on-week (67% versus 61% in 2017).
However 3 of the top 5 state corn producers saw their ratings unchanged or higher including Iowa up 1% to 74% good-to-excellent, Indiana up 2% to 72%, and Minnesota unchanged at 75%.
With the September 2018 WASDE report due to be released next Wednesday, September 12th, traders continue to speculate on what adjustment the USDA will make to its August 2018/19 U.S. corn yield forecast of 178.4 bpa (total production of 14.586 billion bushels). Some of the most recent notable private September U.S. corn yield estimates are as follows:
- FCStone – 177.7 bpa / total production 14.532 billion bushels
- Michael Cordonnier – 178.0 bpa / total production 14.500 billion bushels
- Informa Economics – 178.8 bpa / total production 14.621 billion bushels
At this point I would say Informa Economics remains the primary outlier projecting a HIGHER yield than the USDA’s August forecast. The vast majority of private estimates have been anticipating a yield reduction; however not of extreme consequence (-0.5 to -1 bpa) as it relates to the potential negative impact a yield decrease could have on lowering 2018/19 U.S. corn ending stocks.
Ultimately I believe it’s going to come down to Iowa and Illinois. Those two states collectively account for approximately one-third of the total U.S. corn crop. Yield adjustments in those two states can single-handedly move the needle on the national figure.
That said there continues to be a somewhat substantial difference of opinion regarding just how good each state’s 2018 corn yield is. FCStone is estimating Iowa’s 2018 corn yield at 201 bpa versus Informa’s forecast of 205 bpa (USDA at 202 bpa in August). Regarding Illinois, FCStone’s at 203 bpa versus Informa’s 207 bpa (USDA at 207 bpa in August). If had to choose I’m Team FCStone on this one…I don’t believe Iowa and Illinois are as good as Informa is projecting. I’m also in the camp believing the U.S. corn yield will eventually drift under 178.0 bpa over time.
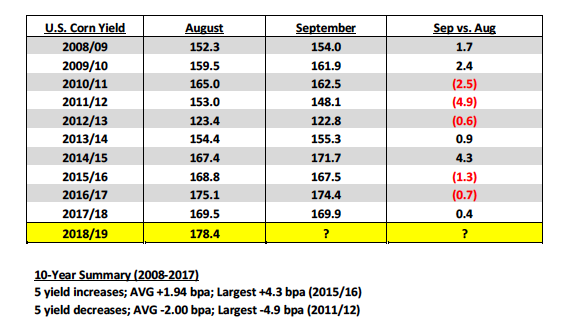
Over the last 10-years, there have been an equal amount of August-to-September U.S. corn yield increases versus decreases. The largest Aug-to-Sep U.S. corn yield increase came in 2015/16 totaling +4.3 bpa (167.4 to 171.7 bpa). Conversely the largest Aug-to-Sep U.S. corn yield decrease occurred in 2011/12 totaling -4.9 bpa (153.0 to 148.1 bpa).
That said I don’t think you can make the case there’s any discernible yield trend from the USDA in the September WASDE report.
It is worth noting that in the September WASDE report the USDA conducts objective yield surveys in the major corn producing states. Farmer operators are interviewed and permission is sought to locate two sample plots in selected fields. Plant populations are recorded along with the number of ears and their weights. The counts are then used with similar data from previous years to develop a projected “biological yield.” Therefore…the market should get more specific detail on this year’s U.S. corn crop and an indication of actual ear weights. Some in the market believe ear weights will be down this year in states such as Illinois (lower ear weights = lower yields). We shall see…
DECEMBER CORN FUTURES TRADING OUTLOOK
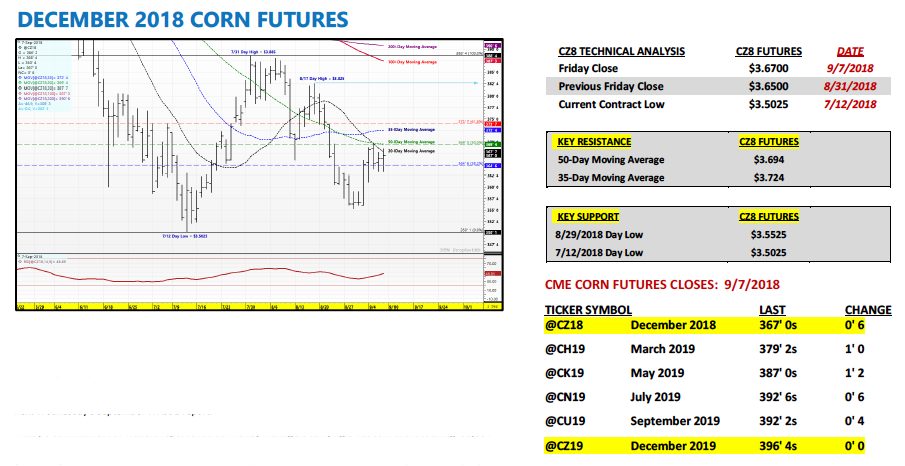
Corn futures inched higher this week; however CZ18 is now approaching levels where traders are being tested as to how confident they actually are that corn can continue working higher with the 50-day moving average (providing strong topside resistance) directly overhead at $3.694.
Thus far the rally off of the 8/29 day low of $3.55 ¼ was what I would consider the “easy” money. That said the next leg higher will likely require real money getting behind this market, as well as, the idea that the U.S. corn yield will indeed be lowered by 1 to 2 bpa in next Wednesday’s September WASDE report.
Friday’s Commitment of Traders report showed Money Managers carrying a net corn short totaling -55,884 contracts as of the market close on 9/4.
However…I’m not convinced the money’s going to cover their shorts or go net long even if the 2018/19 U.S. corn carryout drops 50 to 75 million bushels in the September Crop report. There are several things working against sustainable corn rallies above $3.70 to $3.75 at this time including a negative price seasonal through October 2nd/3rd(consistent with the 5, 15, and 30-year patterns). Also, I fully expect producers to start making room for their 2018 corn (and soybeans) harvest, which should equate to increased farmer cash corn movement irrespective of price and therefore a significant Commercial hedge presence.
The December corn futures highs during the month of September the last 3-years have been $3.94 in 2015, $3.4325 in 2016, and $3.62 in 2017. Thus far the 2018 CZ high stands at $3.6975. 2015 would suggest rallies above $3.75 are possible; however the biggest drag on corn futures this year continues to be the soybean market and the possibility of 2018/19 U.S. soybean ending stocks moving past an almost unthinkable 850 million bushels in the September Crop report. Once again I want to own corn but not on rallies on or near key resistance….
Twitter: @MarcusLudtke
Author hedges corn futures and may have a position at the time of publication. Any opinions expressed herein are solely those of the author, and do not in any way represent the views or opinions of any other person or entity.
Data References:
- USDA United States Department of Ag
- EIA Energy Information Association
- NASS National Agricultural Statistics Service

: Worrisome to Broader Market?")


