March corn futures closed down 4 cents per bushel last week, finishing near $3.74.
Corn continues to trade in a range as 2019 gets underway. Let’s discuss several key news spotlights, along with current market data and trends.
On Friday the USDA’s much delayed and therefore much anticipated Crop Production, monthly WASDE, and Grain Stocks reports were released finally giving the market some updated S&D data to digest. A summary of those reports is as follows:
CORN HIGHLIGHTS
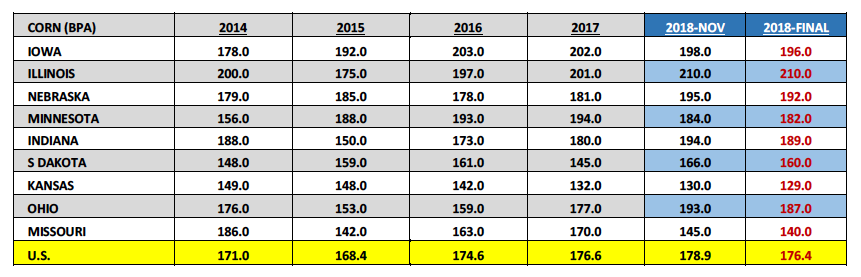
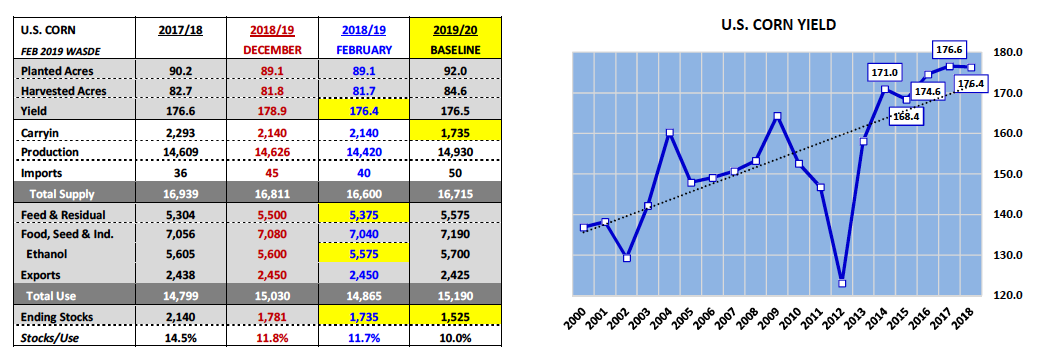
The USDA lowered its 2018/19 U.S. corn yield estimate 2.5 bpa to 176.4 bpa (versus 178.9 bpa in December). Total 2018/19 U.S. corn production dropped to 14.420 billion bushels, down 206 million bushels from December.
2018/19 U.S. corn ending stocks fell to 1.735 billion bushels versus 1.781 billion bushels in December and 2.140 billion in 2017/18.The supply-side adjustments exceeded market expectations with the pre-report average trade guess on yield at 177.9 bpa and total production at 14.532 billion bushels. Furthermore this marked the 5thtime in the past 6-years the USDA has lowered the U.S. corn yield from December to “FINAL” and also represented the largest yield decline over that time period.
The USDA lowered its state corn yield figures versus its November estimates in virtually every major corn producing state in the country.
Iowa saw its corn yield reduced -2 bpa to 196 bpa, Nebraska -3 bpa to 195 bpa, Minnesota -2 bpa to 182 bpa, and Indiana -5 bpa to 189 bpa. Therefore of the top 5 state corn producers in the U.S. only Illinois saw its corn yield unchanged versus November at 210 bpa, which represented a new record high for IL by 9 bpa.
On the demand side of the ledger the USDA went to great lengths to neutralize the U.S. corn production decrease by lowering 2018/19 total U.S. corn demand 165 million bushels versus November to 14.865 billion bushels.
Specifically the USDA dropped Feed & Residual use 125 million bushels to 5.375 billion bushels and also reduced U.S. corn-ethanol demand 25 million bushels to 5.575 billion bushels. Therefore the net adjustment to 2018/19 U.S. corn ending stocks versus December was just -46 million bushels with the stocks-to-use ratio fading only marginally to 11.7%. If there was a demand sector surprise I would argue it was the cut to Feed & Residual use…
As far as the WORLD figures were concerned, the USDA increased its Argentina 2018/19 corn production forecast 4 MMT to 46.0 MMT while leaving Brazil’s unchanged at 94.5 MMT. Therefore collectively Argentina and Brazil’s total 2018/19 corn production is expected to reach 140.5 MMT versus 115.0 MMT in 2017/18. This should mean more export competition for the U.S.in Jun/Jul/Aug. I will add that approximately 70% of Brazil’s 2018/19 corn production remains a significant unknown considering Brazil is just starting to plant its “safrinha” corn crop, which represents the lion’s share of its corn supply. Therefore there still could be considerable movement in Brazil’s corn production forecast moving forward.
SOYBEANS HIGHLIGHTS
The USDA lowered the 2018/19 U.S. soybean yield 0.5 BPA to 51.6 BPA. Total 2018/19 U.S. soybean production dropped to 4.544 billion bushels, down 56 million bushels from December.
2018/19 U.S. soybean stocks fell to 910 million bushels versus 955 million in December. Additionally, the USDA’s WORLD figures offered a 5 MMT decrease to Brazil’s 2018/19 soybean production, which was estimated at 117.00 MMT versus 122.0 MMT in December and 120.80 MMT in 2018/19. Also of note the USDA lowered China’s 2018/19 soybean imports 2 MMT to 88 MMT, which compares to imports of 94.1 MMT in 2017/18.
MARCH CORN FUTURES TRADING OUTLOOK
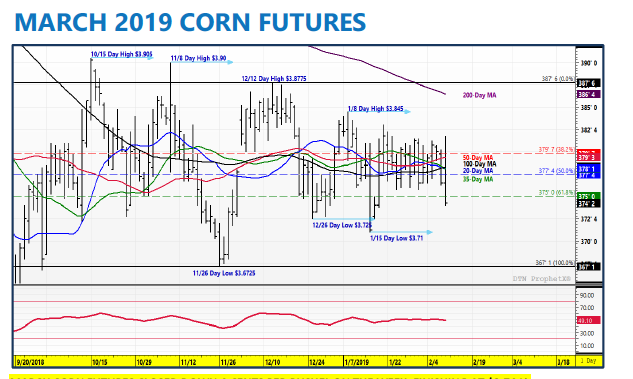
Clearly the February WASDE and Crop Production reports did not provide the upward spark Corn Bulls were hoping for. What’s to blame then for the markets lack of buying interest in what ultimately served as yet another reminder that 2019/20 U.S. corn carryin stocks will likely be the lowest since 2015/16?
Two things in particular continue to weigh on not only the commodity markets but also the U.S. economy in general.
Those being the threat of another U.S. government shutdown followed by the March 1stdeadline for a U.S.-China trade deal. Speaking of the later, President Trump was recently quoted as saying that he and Chinese President Xi would not meet again before March 1st. Therefore now traders can ponder for approximately the next 3 weeks whether or not the Trump Administration will more than double tariffs on $200 billion of Chinese goods or simply extend the current tariffs. Neither outcome provides what ultimately needs to happen for the Ag markets to start feeling comfortable again regarding the sustained reemergence of China back in buying U.S. soybeans (and possibly even corn) on a weekly basis.
As far as another U.S. government shutdown is concerned, if that happens it will likely mean the cancelation of the USDA’s 95thannual Ag Outlook Forum on February 21st-22nd.
Traditionally this conference provides a snapshot for the 2019/20 U.S. corn and soybean S&D tables (which aren’t officially released until the May 2019 WASDE report). That said I’m assuming the USDA would revisit their 2019 planted acreage estimates for U.S. corn and soybeans while possibly making some adjustments to the Baseline acreage figures they released in November 2018 (which called for +2.9 million more corn acres and -6.6 million fewer soybeans acres). Given the new-crop soybean (SX19) / corn (CZ19) price ratio currently trading at 2.40, I would argue it’s very unlikely the U.S. gains that many corn acres this spring nor loses as many soybean acres.
Therefore, I remain Bullish corn longer-term…if anything the current market and updated Feb WASDE figures further support that position.
Twitter: @MarcusLudtke
Author hedges corn futures and may have a position at the time of publication. Any opinions expressed herein are solely those of the author, and do not in any way represent the views or opinions of any other person or entity.
Data References:
- USDA United States Department of Ag
- EIA Energy Information Association
- NASS National Agricultural Statistics Service


