July corn futures closed DOWN 14 ½-CENTS per bushel week-on-week, finishing at $3.91 ½.
This is a pretty big move to the downside and has corn bulls on their heels. Will they fight back this week?
Here’s a rundown of the latest corn market highlights, along with my corn futures weekly forecast:
Monday’s Weekly Crop Progress report showed U.S. corn planting progress improving to 92% for the week ending May 27th, 2018. This compares to 90% in 2017 and the 5-year average of 90%.
The top 5 state corn producers now all have corn planting percentages above their 5-year averages. Illinois was 100% planted versus its 5-year average of 94%, Indiana 95% planted versus 85%, Iowa 96% planted versus 95%, Minnesota 93% planted versus 92%, and Nebraska 96% planted versus 95%. Additionally South Dakota, another key corn producing state that had some catching up to do saw its planting percentage improve to 91%, just 1% below its 5-year average.
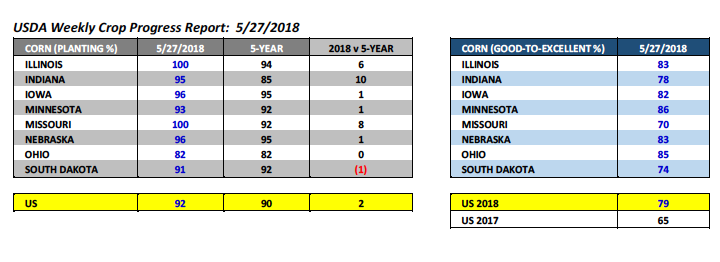
The USDA also issued their first corn condition ratings for 2018 in Monday’s report. The U.S. corn good-to-excellent rating was projected at an incredibly high 79% versus 65% in 2017.
I’ve said for several weeks that I fully expect the USDA to over-compensate with high good-to-excellent ratings in 2018 based on them completely blowing it a year ago via low corn ratings ultimately resulting in a record 2017/18 U.S. corn yield of 176.6 bpa. Condition ratings in my opinion have always been extremely subjective and this year I would anticipate the USDA’s crop surveyors’ “erroring” on the side of being overly optimistic regarding yield potential. That said once again as it relates to the top 5 state corn producers, all 5 had very strong initial good-to-excellent ratings. Illinois’s corn crop was rated 83% good-to-excellent, Indiana 78%, Iowa 82%, Minnesota 86%, and Nebraska 83%.
The immediate question I’ve been asked is what’s the precedent for the USDA possibly increasing its 2018/19 U.S. corn yield estimate in the June WASDE report on account of strong, early growing season good-to-excellent ratings?
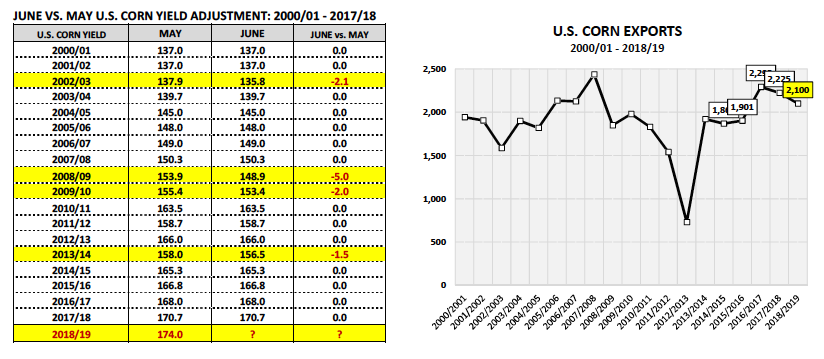
Since 2000, the USDA has NEVER increased its corn yield forecast in the June report versus May. They have decreased it on 4 separate occasions (2002/03, 2008/09, 2009/10, and 2013/14); however there have been zero increases. Therefore I’m not expecting any adjustment to the USDA’s current yield estimate of 174 bpa in the June Crop report (which will be released on June 12th).
U.S. corn weekly export inspections totaled an impressive 67.1 million bushels for the week ending 5/24/18.
This was even slightly better than the previous week’s total of 60.9 million bushels. Crop year-to-date corn inspections improved to 1.497 billion bushels; however that figure was still nearly 12% behind a year ago. That said I’m assuming weekly U.S. corn shipments will remain strong during June, July, and August.
Why? There continues to a be a wide range of opinions regarding the production prospects for Brazil’s 2017/18 safrinha crop crop, which accounts for approximately 70% of Brazil’s total corn production (and is harvested during Jun/Jul/Aug). Since late May private analysts have issued safrinha corn production estimates ranging from as low as 48.7 MMT to as high as 62.9 MMT (versus approximately 66 MMT in 2016/17). Invariably world corn buyers have been taking note of this potential corn production shortfall in Brazil, the world’s 2ndlargest corn exporter. The market response from world corn importers has been to use the U.S. market as a hedge against lower Brazilian corn production, and we are now starting to see those U.S. sales actually shipped. This is a very good sign for U.S. corn export demand both short and long-term.
JULY 2018 CORN FUTURES PRICE FORECAST:
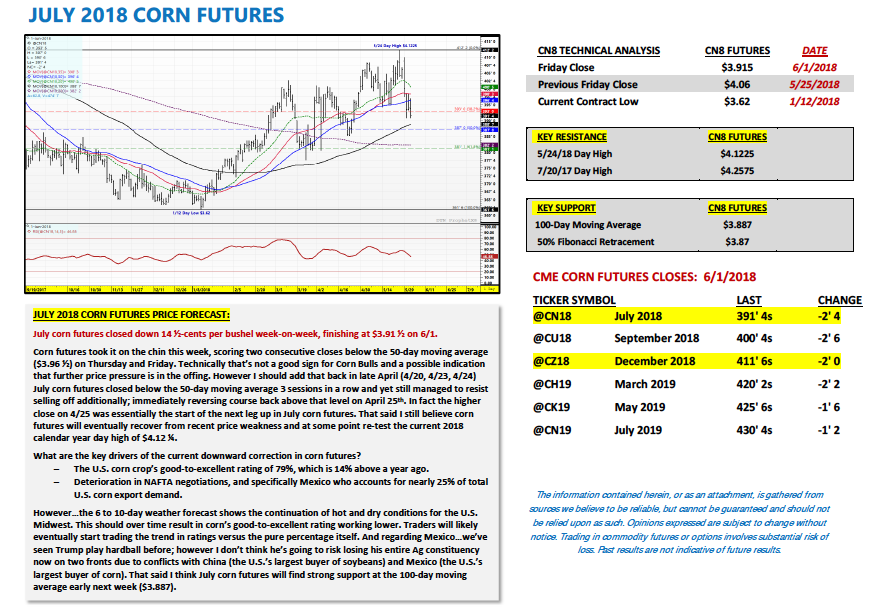
July corn futures closed down 14 ½-cents per bushel week-on-week, finishing at $3.91 ½ on 6/1.
Corn futures took it on the chin this week, scoring two consecutive closes below the 50-day moving average ($3.96 ½) on Thursday and Friday. Technically that’s not a good sign for Corn Bulls and a possible indication that further price pressure is in the offing. However I should add that back in late April (4/20, 4/23, 4/24) July corn futures closed below the 50-day moving average 3 sessions in a row and yet still managed to resist selling off additionally; immediately reversing course back above that level on April 25th. In fact the higher close on 4/25 was essentially the start of the next leg up in July corn futures. That said I still believe corn futures will eventually recover from recent price weakness and at some point re-test the current 2018 calendar year day high of $4.12 ¼.
What are the key drivers of the current downward correction in corn futures?
- The U.S. corn crop’s good-to-excellent rating of 79%, which is 14% above a year ago.
- Deterioration in NAFTA negotiations, and specifically Mexico who accounts for nearly 25% of total U.S. corn export demand.
However, the 6 to 10-day weather forecast shows the continuation of hot and dry conditions for the U.S. Midwest. This should over time result in corn’s good-to-excellent rating working lower. Traders will likely eventually start trading the trend in ratings versus the pure percentage itself. And regarding Mexico… we’ve seen Trump play hardball before; however I don’t think he’s going to risk losing his entire Ag constituency now on two fronts due to conflicts with China (the U.S.’s largest buyer of soybeans) and Mexico (the U.S.’s largest buyer of corn). That said I think July corn futures will find strong support at the 100-day moving average early next week ($3.887).
Twitter: @MarcusLudtke
Author hedges corn futures and may have a position at the time of publication. Any opinions expressed herein are solely those of the author, and do not in any way represent the views or opinions of any other person or entity.
Data References:
- USDA United States Department of Ag
- EIA Energy Information Association
- NASS National Agricultural Statistics Service

: Worrisome to Broader Market?")


