December corn futures traded higher by 5 1/2 CENTS per bushel week-on-week.
Let’s review current news, data releases, and market trends with a look to the week ahead (September 24). We’ll also tackle the question:
What’s the potential market risk below $3.50 in December corn futures during the months of October and November?
That seems to be the most pressing question at this time with a number of producers wanting to re-own a percentage of whatever they are forced to sell over the next 30 to 45-days.
This week I looked back on the price action in December corn futures during October and November from 2014 – 2017. All of those years were similar to 2018 in that they featured record to near-record U.S. corn yields, as well as, what I would define as “comfortable” U.S. corn ending stocks projections.
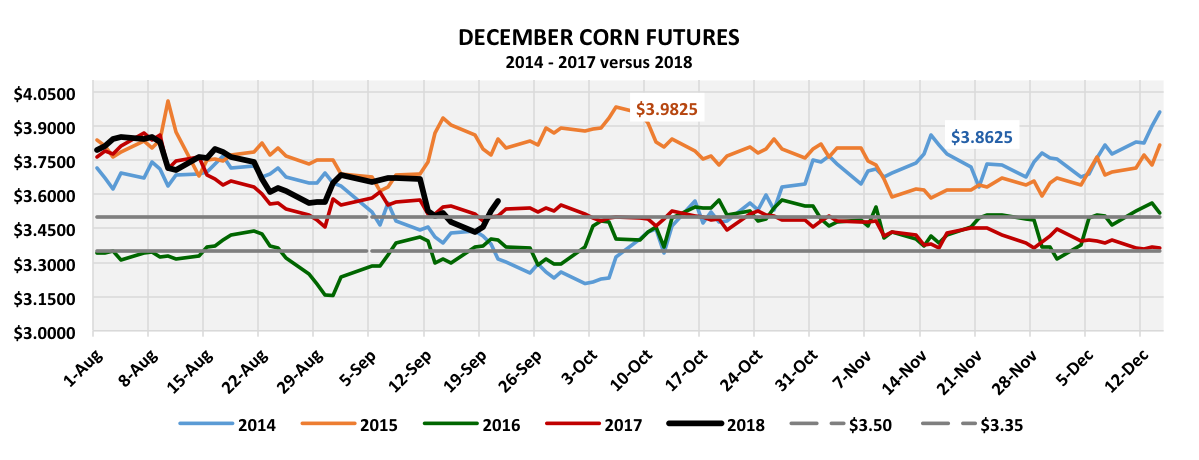
There were a couple immediate CZ futures price takeaways, which included:
In each of the last 4 years, December corn futures have at some point traded back over $3.50 per bushel during the months of October or November.
Last year (2017) represented the narrowest price moves back over the $3.50 price threshold with CZ17 trading up to monthly day high of $3.56 ¼ on 10/1. In November 2017, the monthly day high was $3.52 on 11/2. The lowest CZ traded during that time period was $3.35 ½ on 11/29; therefore there was a 14 ½-cent risk below $3.50 throughout October and November 2017.
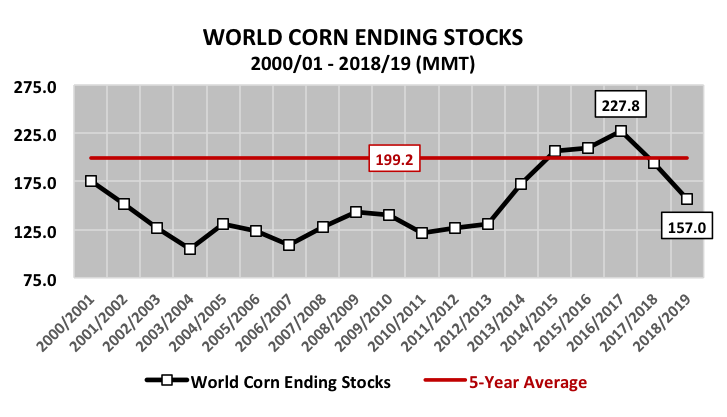
ALSO KEEP IN MIND THE FOLLOWING…in 2017 during the months of September, October, and November, the USDA was estimating 2017/18 U.S. corn ending stocks at an average of 2.387 billion bushels (in their monthly WASDE reports). The average U.S. corn stocks-to-use ratio was forecasted at 16.7%. Comparatively this year’s 2018/19 U.S. corn carryout was just estimated at 1.774 billion bushels in the September WASDE report, which equated to a stocks-to-use ratio of 11.7%. That’s a substantial negative differential versus last year (-613 million bushels in ending stocks and -5% in stocks-to-use).
On more than one occasion, December corn futures have rallied back over $3.85 per bushel during the months of October and November (2014 and 2015). Specifically in 2015 December corn futures rallied up to a day high of $3.99 ¾ on October 7th.
More importantly if you look at the U.S. corn market fundamentals that drove the price rally in 2015, you’ll see they look eerily similar to 2018/19.
In 2015 during the months of September, October, and November, the USDA estimated 2015/16 U.S. corn ending stocks at an average of 1.638 billion bushels (in their monthly WASDE reports), which equated to an average U.S. corn stocks-to-use ratio of 11.9%. Once again as I mentioned previously…current 2018/19 U.S. corn ending stocks were just forecasted at 1.774 billion bushels; with the stocks-to-use ratio projected at 11.7%.
All that being said… what are the most glaring differences between 2018 and years 2014-2017?
- The U.S. is in a trade war with China, the world’s largest soybean importer (accounting for more than 60% of total world soybean imports). This was headline news again this week with Trump initiating another $200 billion in tariffs on Chinese goods. China retaliated with $60 billion in tariffs on U.S. goods (several aimed at agriculture). November soybean futures broke to new contract lows on Tuesday morning as a result. That said I believe the corn market is still being negatively influenced by the continued weakness in soybean futures, which is a byproduct of this year’s forecasted record U.S. soybean yield (52.8 bpa) and record U.S. soybean ending stocks (845 million bushels; partially due to lost soybean export demand to China).
- The USDA is forecasting not just a record U.S. corn yield for 2018/19, but a record by 4.7 bpa or +2.7% (181.3 bpa versus the prior record of 176.6 bpa). Furthermore several private analysts have now jumped on the USDA’s bandwagon post-September WASDE report and are projecting an even higher yield coming in the October 2018 WASDE report. Therefore traders have to yet transition away from the supply-side narrative, which remains fixated on the “big crops get bigger” storyline. Therefore until the USDA offers some indication that this year’s record-breaking U.S. corn yield has peaked in its monthly WASDE reports; it’s going to be very difficult to force the market to look at U.S. corn ending stocks and the stocks-to-use ratio, with both of those figures price supportive in my opinion sub-$3.50 CZ18.
Overall, I’ve been saying for a couple weeks now that I want to own corn at levels I believe represent value longer-term and I think we’re there ($3.40-$3.45 CZ).
Once again when you consider the 2017 CZ contract/harvest low was $3.35 ½ with a sizably higher U.S. corn carryout, the fundamentals suggest corn is undervalued. Obviously the aforementioned outliers remain with the biggest Wild Card still the Trump vs China trade war. That said if corn can break free from the negativity surrounding soybean futures, I believe Corn Bulls have a chance in October and November for 25 to 35-cent rallies from current price levels.
DECEMBER CORN FUTURES TRADING OUTLOOK
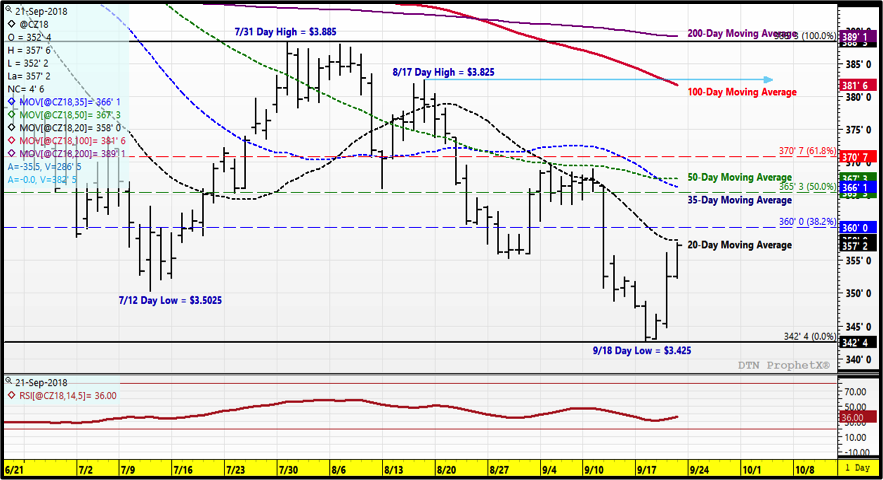
December corn futures responded extremely well the 2ndhalf of the week after trading down to a new contract low of $3.42 ½ on Tuesday morning. CZ bounced nearly 15-cents per bushel from that low, closing just shy of the 20-day moving average of $3.58 Friday afternoon.
Monday and Tuesday’s sessions were dominated once again by Trump v China trade talks with President Trump initiating another $200 billion in tariffs on Chinese goods Monday evening. China retaliated on Tuesday with an additional $60 billion in tariffs on U.S. goods. The new Chinese levies were focused specifically on U.S. farm products and machinery. As a result November soybeans traded down to a new contract low of $8.12 ½ on Tuesday.
Also of note…on Tuesday Informa Economics released its initial 2019 U.S. planted acreage estimates. In corn Informa forecasted 2019 U.S. planted corn acreage of 93.04 million acres, up 3.9 million acres versus 2018. Informa’s 2019/20 U.S. corn production estimate was 15.256 billion bushels (yield of 178 bpa). If realized this would represent a new record high for U.S. corn production, exceeding the current record of 15.148 billion bushels from 2016/17.
Overall Corns Bulls have to be happy with the way corn responded late in the week. Technically as I mentioned earlier I still wouldn’t short CZ under $3.50 based on the price action the last 4-years during October and November. Additionally with the corn harvest now just underway…the burden of proof shifts to actual harvest results to solidify and validate what the USDA continues to tell is another recording breaking year for U.S. corn yields.
Twitter: @MarcusLudtke
Author hedges corn futures and may have a position at the time of publication. Any opinions expressed herein are solely those of the author, and do not in any way represent the views or opinions of any other person or entity.
Data References:
- USDA United States Department of Ag
- EIA Energy Information Association
- NASS National Agricultural Statistics Service

: Worrisome to Broader Market?")


