December corn futures closed up nearly 8 cents last week, providing much needed relief to corn bulls.
Are corn investors (and prices) ready to exit this difficult environment?
Let’s review the latest market data and price trends for Corn (NYSEARCA: CORN) with an eye toward the week ahead (December 10).
Monday’s session was dominated by reaction to the Trump – Xi Jinping meeting at the G20 summit in Argentina.
Trump insinuated the meeting was a huge success. An informal agreement (or an implied mutual understanding) was achieved suggesting that China would purchase “a not yet agreed upon, but very substantial, amount of agricultural, energy, industrial, and other product from the United States to reduce the trade imbalance between our two countries.” In exchange the U.S. would not raise tariffs an additional $200 billion on Chinese goods over the next 90 days.
As it related specially to agriculture President Trump then tweeted “Farmers will be a very BIG and FAST beneficiary of our deal with China. They intend to start purchasing agricultural product immediately.” January soybean futures responded by opening a gap higher Monday morning, trading up to a day high of $9.23 ¾ (highest tick since 8/9/2018); however that momentum would prove unsustainable with SF9 eventually fading back to finish at $9.05 ¾ that afternoon.
What now? I’m in the camp of those traders maintaining an “I’ll believe it when I see it” mentality regarding China’s willingness to start buying U.S. agricultural products again and specifically soybeans.
For one the response and reaction from Chinese news media outlets regarding the progress made at the G20 summit between the U.S. and China was much more subdued. There was also more ambiguity from China pertaining to the actual implications and timing of them re-opening their markets to U.S. products. China’s tone was centered on “market demand” driving the future expansion of U.S. imports.
None of that suggests to me that China is ready to acquiesce to President Trump on trade; even with Trump reiterating on Monday that China has 90-days to make measurable steps in reducing the current trade imbalance or the tariff increase will be back in play. That said I’ll need to see China physically buy and receive shipment of U.S. soybeans in the FAS’s weekly export sales/inspections summaries; sometime in the next 2 or 3 weeks before I buy the notion trade relations have improved. Until then the champagne bottle will remain corked. As it stands currently U.S. soybean export inspections from 2018/19 remain 42% behind a year ago (-353 million bushels) as of the end of November.
The U.S. ethanol industry’s negative margin watch continued this week with traders searching for signs of ethanol production decreases via the EIA’s Weekly Petroleum Status report. Surprisingly…that did not happen.
The EIA reported weekly ethanol production of 1.069 million barrels per day for the week ending 11/30/2018; up from 1.048 MMbpd the previous week and the 4-week average of 1.056 MMbpd. U.S. ethanol stocks inched higher to 23.0 million barrels. CME January ethanol futures responded to the report by closing down approximately 4-cents per gallon Thursday afternoon at $1.229; a new contract low was also established at $1.225. Suffice it to say the negative margin pressure continues in the ethanol industry.
Friday’s Weekly Export Sales report showed U.S. corn export sales of 46.4 million bushels for the week ending 11/29/2018.
Crop year-to-date export sales improved to 1.053 billion bushels, up 17% from a year ago or +151.5 million bushels. In the November 2018 WASDE report the USDA estimated 2018/19 U.S. corn exports at 2.450 billion bushels, an increase of just +½% versus 2017/18. Will the USDA increase its export forecast in the December 2018 WASDE report? I’m of the opinion the USDA will hesitate before making future increases with most traders expecting a substantial recovery in 2018/19 Brazilian corn production, which should compete with U.S. corn exports during Jun/Jul/Aug 2019.
Corn Futures Trading Outlook:
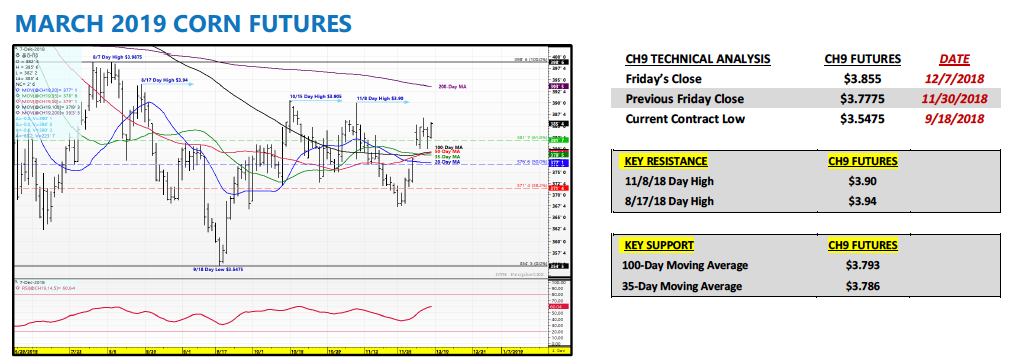
Corn futures traded decidedly higher this week (aided in large part by a gap higher opening on Monday morning); showing signs of a much more price supportive outlook heading into calendar year end and beyond. For weeks I’ve been suggesting I have a more Bullish opinion on corn as we transition to 2019 and that viewpoint remains unchanged for 3 primary reasons:
I expect the USDA to lower its 2018/19 U.S. corn yield estimate of 178.9 bpa yet again in its final production summary in the January 2019 WASDE report.
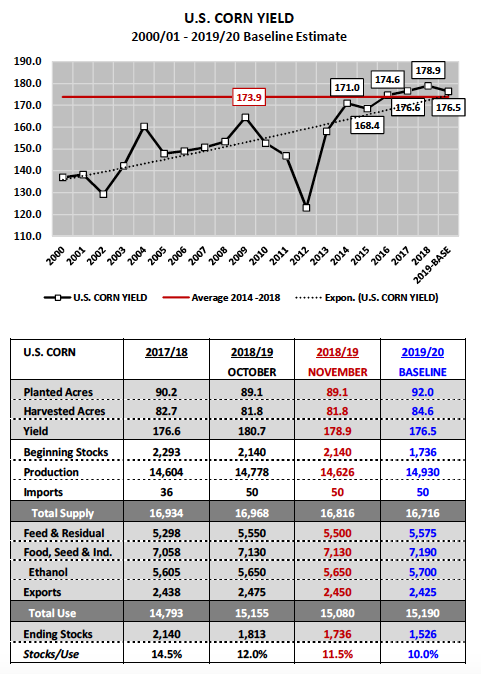
In 4 out of the last 5 years the USDA has lowered the U.S. corn yield from November to January on average -1.4 bpa. Furthermore, the USDA has already shown its hand in my opinion by lowering the 2018/19 U.S. corn yield the previous two months a combined -2.4 bpa from its high-water mark of 181.3 bpa in September. This leads into my second point…
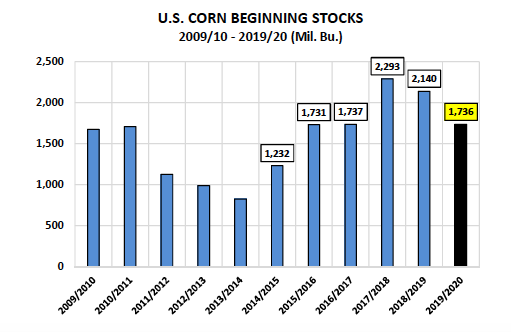
2019/20 U.S. corn beginning stocks are expected to be the lowest they’ve been since 2015/16 at 1.736 billion bushels. Additionally this figure could continue to come down if indeed 2018/19 U.S. corn production is trimmed in the January WASDE report due to my aforementioned yield decrease assumption. The significance of lower beginning stocks equates to vastly less margin for error regarding the need to add at least 3 million corn acres in 2019/20, as well as, secure a trend-line (176.5 bpa) or better U.S. corn yield. Corn futures will need to acknowledge these major “unknowns” by establishing some sort of premium as early as February 2019.
Even with a 2019/20 U.S. corn yield of 176.5 bpa and 92.0 million planted corn acres (+2.9 mil.), 2019/20 U.S. corn ending stocks currently pencil back at just 1.526 billion bushels (stocks-to-use ratio 10%).
If the U.S corn yield were to fall to even 170.5 bpa, the U.S. corn carryout would dip to approximately 1.0 billion bushels (stocks-to-use ratio of 6.6%).
My detractors would suggest with ethanol margins struggling and Brazilian corn exports likely to rebound in 2019/20, the USDA’s Baseline 2019/20 total usage forecast of 15.190 billion bushels will likely prove too high. That might be true but I don’t foresee the USDA making major changes to its Baseline demand outlook until July 2019 at the earliest, which means the U.S. corn S&D reflected until that time will likely continue to suggest the need for corn futures to maintain a firm undertone.
Twitter: @MarcusLudtke
Author hedges corn futures and may have a position at the time of publication. Any opinions expressed herein are solely those of the author, and do not in any way represent the views or opinions of any other person or entity.
Data References:
- USDA United States Department of Ag
- EIA Energy Information Association
- NASS National Agricultural Statistics Service

: Worrisome to Broader Market?")


