March corn futures closed up a cent last week, finishing near $3.75.
Corn continues to trade in a tight range in early 2019. But there’s a lot going on with the fundamental picture. Let’s discuss several key news spotlights, along with current market data and trends.
On Thursday and Friday this week the USDA’s 95thannual Ag Outlook Forum commenced in Arlington, Virginia. Below are some of the key takeaways from this year’s conference:
2019 U.S. Corn & Soybean Acreage
USDA chief economist Robert Johannson issued projections for 92 million planted corn acres this spring versus 85 million planted soybeans acres.
The 92 million corn acres is the same forecast the USDA offered in its “Baseline” estimates back in November and would represent an acreage increase of 2.9 million acres versus 2018. Last week Informa Economics issued its revised 2019 U.S. corn planted acreage estimate of 91.591 million acres, therefore slightly below the USDA’s projection. Informa estimated 2019 U.S. soybeans planted acreage of 86.044 million acres.
REACTION
Count me in the camp of those still not seeing the economic justification for a 2.9 million planted acreage increase in corn for 2019 (or a 4.2 million planted acreage reduction in soybeans). The new-crop soybean (SX19) / corn (CZ19) price ratio continues to trade in a range of approximately 2.37 to 2.39, which doesn’t necessarily swing the economics highly in favor of planting corn or soybeans.
The argument could be made that given the negativity surrounding the soy complex and the potential price “hangover” from record 2018/19 U.S. soybean ending stocks of 910 million bushels, corn futures upside in 2019 seems more favorable. That said even if that’s the case I still believe December corn futures should be trading closer to $4.25 per bushel to elicit that type of acreage increase (with November soybean futures trading near $9.55) versus a current December corn futures market seemingly unable to sustain rallies over the January 18thday high of $4.06.
Notable Quote from the Ag Outlook Forum: (Johnannson referencing the state of the U.S. soybean market)“The record-high stocks in the U.S. due to the trade situation will take several years to unwind, which will weigh on U.S. prices going forward even with potential China purchase agreements.”
Therein lies the USDA’s long-term sentiment on soybeans, which is likely the reason the USDA sees 2019 U.S. soybean acres contracting significantly. It’s worth noting that the USDA will not revisit their latest estimates for 2019/20 U.S. corn and soybeans planted acreage until the March 29th, 2019, Prospective Plantings report.
AG OUTLOOK 2019/20 U.S. CORN BALANCE SHEET
The USDA issued a 2019/20 U.S. corn yield estimate of 176.0 bushels per acre. Total production was projected to reach 14.890 billion bushels. On the demand side, 2019/20 total U.S. corn use was estimated at 15.015 billion bushels, representing an increase of 150 million bushels versus 2018/19. The net result was 2019/20 U.S. corn ending stocks of 1.650 billion bushels (stocks-to-use ratio of 11%). If realized this would be the lowest corn carryout figure for the U.S. since 2013/14.
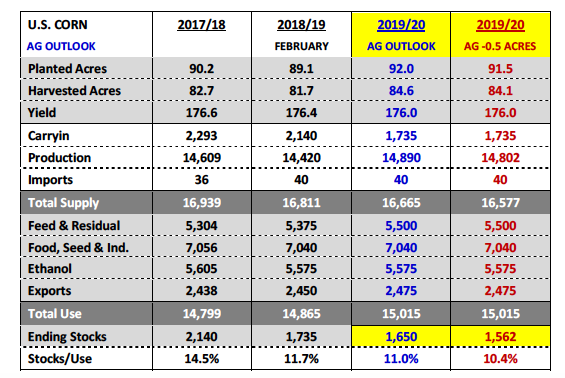
Furthermore if the USDA’s planted corn acreage forecast proves 0.5 million acres too high (and assuming everything else remains static), 2019/20 U.S. corn ending stocks would fall to 1.562 billion bushels (stocks-to-use ratio of 10.4%).
REACTION
I’ve been saying this for the last two months but I believe the 2019/20 U.S. corn balance sheet is the most constructive S&D Corn Bulls have seen in at least 4 crop years. I also feel strongly traders will be harder to convince in 2019/20 that a U.S. corn yield above 177 bpa is possible unless weather conditions are near perfect across ALL top 5 corn producing states (IA, IL, NE, MN, IN) throughout the entirety of the summer growing season. The last two years have shown that achieving a U.S. corn yield above the 2017/18 record high of 176.6 is no small task.
That said I fully expect traders to been more sensitive to any minor summer weather events in 2019, knowing there isn’t the supply cushion (via carryin stocks) that we’ve had the last 2 crop years to compensate for a national corn yield falling below 174 bpa. The U.S. corn carryout could get very tight in 2019/20 even with a small below-trend yield deviation.
AG OUTLOOK 2019/20 U.S. SOYBEANS BALANCE SHEET
The USDA issued a 2019/20 U.S. soybean yield estimate of 49.5 bushels per acre, down 2.1 bpa from 2018/19 however essentially on par with 2017/18’s final yield of 49.3 bpa. Total production was forecasted at 4.175 billion bushels. 2019/20 total U.S. soybean demand was estimated at 4.260 billion bushels, representing an increase of 168 million bushels versus 2018/19. The USDA did move 2019/20 U.S. soybean exports back up to 2.025 billion, which approaches pre-China tariff export levels. The net result was 2019/20 U.S. soybean ending stocks of 0.845 billion bushels (stocks-to-use ratio of 19.8%). If realized this would be the 2ndhighest U.S. soybean carryout figure ever.
REACTION
I wasn’t surprised by any of the figures in soybeans. I think the USDA’s estimates simply reaffirm what the trade already knows, which is U.S. soybean ending stocks are likely to remain excessively high for possibly the next 2 to 3 years (even with significant acreage contraction and some transition back to trend to slightly below-trend yields). The USDA’s planted acreage estimate of 85.0 million acres seems more in-line with recent private projections and well above the USDA’s “Baseline” forecast released last November of 82.5 million acres.
If you want to argue anything it could be the USDA’s assumption that 2019/20 U.S. soybean exports will recover back up to 2.025 billion bushels, up 150 million bushels from 2018/19. However, the real price impact of the USDA’s Ag Outlook estimates is that it should effectively cap rally attempts above $9.70 to $9.80 in November soybean futures well into the spring. It’s possible that a trade deal scored with the Chinese provides the fuel for a short-term excursion above those levels; however I can’t see how that move proves sustainable with ending stocks of 845 million bushels presumably being walked forward.
MARCH Corn Futures Trading Outlook
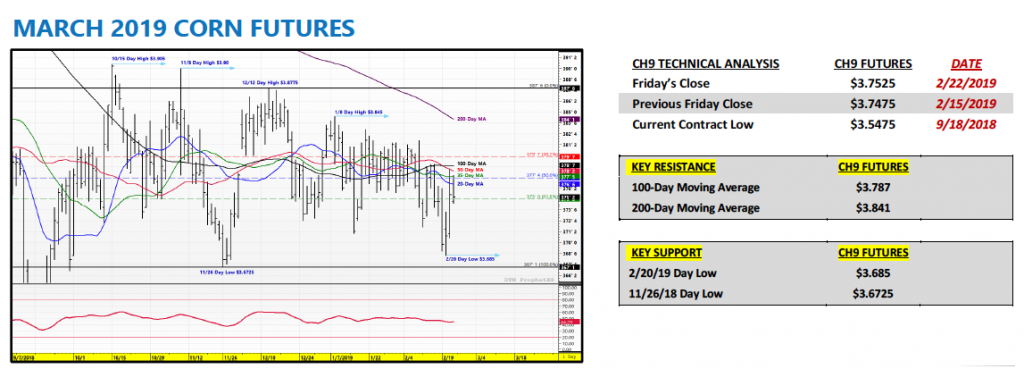
Corn futures continued to move in primarily a sideways fashion this week despite fighting off some additional selling pressure on Tuesday and Wednesday.
In fact on Wednesday, March 2019 corn futures traded down to a day low of $3.68 ½ (lowest tick since 11/28/2018) before recovering later in the session.
On Thursday both corn and soybean futures received a boost from a report via Bloomberg suggesting China was intending to propose buying an additional $30 billion of U.S. agricultural imports a year.
This came on the heels of comments earlier this week from President Trump that insinuated China would also be buying “a lot” of U.S. corn.
And finally on Friday the market received the USDA’s 2019/20 balance sheets for both U.S. corn and soybeans with the corn estimates in particular reinforcing the need for a higher pricing floor in corn futures well into LH May/FH June.
What’s my biggest frustration at the moment with the corn market (and I’m going to assume I’m not alone)?
Every week it seems the corn market’s fate is largely being determined by a politically changed comment from someone involved in U.S. – China trade negotiations versus actual, real-time S&D/market specific pricing considerations. The give and take from one quote to the next has in my opinion kept corn futures in a very confined trading range with Money Managers not wanting to expose themselves (exceedingly long or short) prior to knowing exactly what the framework of some future trade deal might look like.
That said with the Trump – March 1sttrade deadline quickly approaching for a U.S. / China tariff compromise, let’s hope the market is close to gaining some real clarity moving forward. This in turn should allow the S&D’s and grain specific headlines to once again dictate future price direction, which I believe provides a much more favorable backdrop for corn futures to sustain rallies above key resistance (i.e. 200-day moving average in CH19 at $3.84).
I remain Bullish corn futures longer-term…
Twitter: @MarcusLudtke
Author hedges corn futures and may have a position at the time of publication. Any opinions expressed herein are solely those of the author, and do not in any way represent the views or opinions of any other person or entity.
Data References:
- USDA United States Department of Ag
- EIA Energy Information Association
- NASS National Agricultural Statistics Service


