SEPTEMBER corn futures closed UP 6 ¾-CENTS per bushel week-on-week, finishing at $3.62.
Let’s review current themes and trends for the week ahead (week of July 30):
Monday’s Weekly Crop Progress report showed the U.S. corn good-to-excellent rating UNCHANGED week-on-week at 72%. This came as a bit of a surprise with Corn Bulls hoping corn’s good-to-excellent rating would continue to fade slightly as it had over the previous 3-weeks falling from 77% on 6/24 to 72% on 7/15. On Tuesday the market responded to the unchanged rating with a 5 ¼-cents per bushel lower close versus September corn futures.
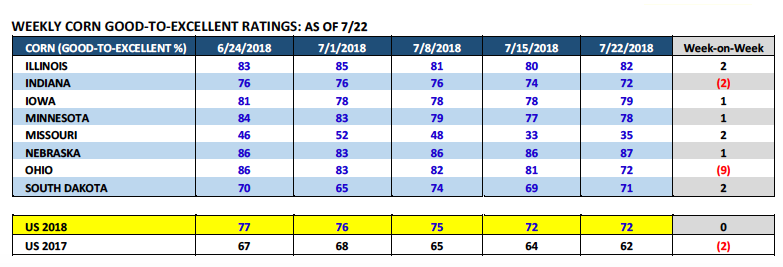
Furthermore all four of the top corn producing states in the country experienced counter-seasonal improvements in their good-to-excellent ratings with Iowa up 1% week-on-week (79%), Illinois up 2% (82%), Nebraska up 1% (87%), and Minnesota up 1% (78%).
Speculation is already building as to what type of national corn yield increase the USDA will offer in the August 2018 WASDE report (released on 8/10/18).
I’m starting to see private yield estimates as high as 177 to 178 bpa with others not discounting the possibility of a final 2018/19 U.S. corn yield above 180 bpa (versus the USDA’s July forecast of 174 bpa).
That said, how Bearish is a 3 to 4 bpa increase in the national corn yield? A 3 bpa yield increase would raise production approximately 250 million bushels; pushing 2018/19 U.S. corn ending stocks up to 1.80 billion bushels. A 4 bpa yield increase would increase production 330 million bushels; resulting in 2018/19 U.S. corn ending stocks of 1.88 bushels.
My reaction to the prospective upward stocks adjustments…I don’t believe those types of carryout figures are as Bearish as what other traders might be indicating.
Reason being even though U.S. corn ending stocks are likely to go up substantially in the August WASDE report, the 2018/19 U.S. carryout will still likely be down considerably from the prior 2-year average of 2.16 billion bushels. Furthermore with September corn futures already having traded down to a day low of $3.37 ¼ on 7/12/18, a level not achieved in September corn futures a year ago until 8/30/17 despite sharply higher carryout projections, one has to wonder if the lion’s share of Bearish news hasn’t already been digested in current futures prices. I tend to fall in the camp of those that believe the corn market has already traded a U.S. corn yield in the 177 to 178 bpa ranges (when CU18 drifted under $3.40). Therefore corn futures don’t necessarily have to continue working lower and lower.
The other prominent storyline this week was President Trump’s announcement of a $12 billion package in emergency aid to American farmers, who have been some of the hardest hit in the U.S.’s ongoing trade war with China.
Both corn and soybean futures have essentially spiraled downward since early June, with China threatening retaliatory tariffs on U.S. corn/soybean imports of 25%. Those tariff fears were substantiated on July 6th, when both the U.S. and China put into effect their anticipated duties. I’ve stated before; however it’s worth reiterating, China accounts for more than 50% of all U.S. soybean exports, proving to be an indispensable trade partner for U.S. farmers.
What’s been the total market price impact on corn and soybean futures?
Since June 1st, August soybean futures have traded from a day high of $10.30 ½ on 6/1 to a day low of $8.10 ½ on 7/16, a total price decline of 21%. Comparatively, September corn futures on June 1stposted a day high of $4.06 versus a day low of $3.37 ¼ on 7/12, a total price decrease of 17%. That said am I placing the entire price break in both corn and soybean futures on the trade war with China? No…invariably some of the weakness has been associated with largely benign summer growing conditions, as well as, strong crop condition ratings.
HOWEVER, given the USDA slashed 2018/19 U.S. soybean exports 250 million bushels in the July 2018 WASDE report, due to what many traders perceive as an acknowledgment by the USDA that U.S. soybean sales to China will drop-off moving forward, I would argue a “healthy” percentage of the recent $2.20 per bushel break in soybean futures is indeed associated with China’s retaliatory tariffs on U.S. soybeans. The reality is has the USDA left U.S. soybean exports unchanged in the July WASDE report, 2018/19 U.S. soybean ending stocks would have been 330 million bushels not 580 million bushels. A 330 million bushel carryout would not equate to November soybean futures trading under $9.00 (or even $9.50) as they are currently.
Later in the week Trump touted positive trade negotiations with the EU, which Trump declared a victory for U.S. soybean farmers; the insinuation being the EU would buy more U.S. soybeans.
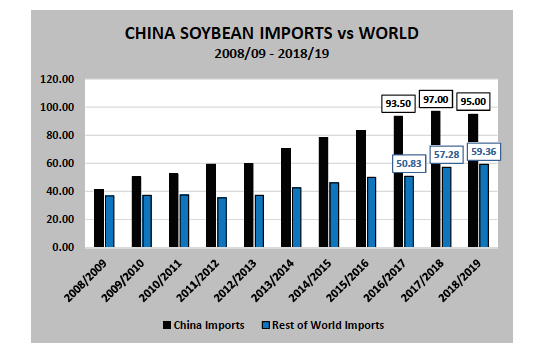
The reality is the EU only imports approximately 15 MMT of soybeans a year worldwide versus China’s forecasted 2018/19 soybean import demand of 95 MMT. Point being a slight uptick in U.S. soybean sales to the EU does not come close to mitigating the damage done to U.S. soybean prices via lost Chinese demand. This is a largely a “win” on paper only and nothing more.
This story is obviously a long way from over however it does appear pressure is mounting on Trump from various farm advocacy groups demanding open markets, not emergency aid.
SEPTEMBER CORN FUTURES TRADING OUTLOOK
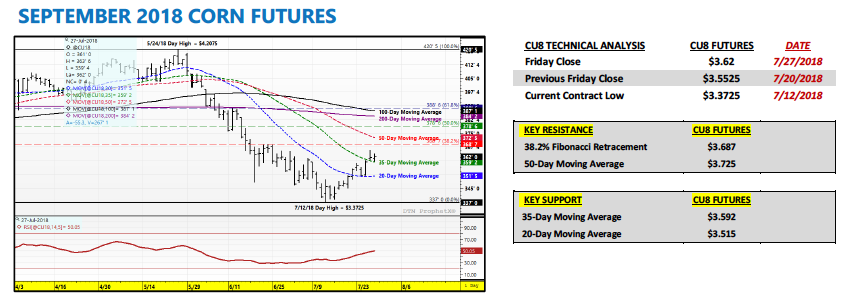
This was the 2nd consecutive week offering a much welcomed higher weekly close for Corn Bulls who were forced to endure an 83 ½-cents per bushel break (high-to-low) in CU18 from 5/24 through 7/12. Furthermore, September corn futures are now trading approximately 25-cents per bushel off their recent contract low of $3.37 ¼; established on July 12th.
Friday’s close at $3.62 will likely prove vital in sustaining the current uptrend, with CU18 working hard late in the session to carve out its 2ndconsecutive close over the 35-day Moving Average at $3.592. The 35-day MA had been an area of key topside resistance since closing below that level on May 30th.
Can this “rally” in corn futures continue next week?
First things first…I’m still not sure I feel comfortable referencing this most recent move higher a “rally.” More likely this is a “topside correction” in a market that had moved lower virtually unimpeded since the last week of May. Point being even Bear markets offer brief respites from consistently lower price action. Fundamentally nothing’s really changed in the corn market. Crop conditions remain excellent and there’s nothing in the 6 to 10-day weather forecast to warrant much if any fear in those ratings fading in early August. That said I’m focusing on the 5 and 10-year pricing seasonals for September corn futures. Both show CU breaking back to its contract lows during the first week of August. Therefore I’d continue to monitor corn’s “strength” closely. I do believe the 50-day Moving Average at $3.725 will likely prove a stopper if CU18 can manage to challenge that level sometime next week.
The one bright spot for Corn Bulls…Friday’s Commitment of Traders report showed Money Managers actually increasing their net corn short week-on-week as of Tuesday’s close to -130,197 contracts. I do believe traders expected this figure to be closer to -75,000 contracts. This could create a higher corn board Monday morning. I, like everyone, am hoping there’s more to this “rally”… However HOPE has never proven a sound trading strategy.
Twitter: @MarcusLudtke
Author hedges corn futures and may have a position at the time of publication. Any opinions expressed herein are solely those of the author, and do not in any way represent the views or opinions of any other person or entity.
Data References:
- USDA United States Department of Ag
- EIA Energy Information Association
- NASS National Agricultural Statistics Service

: Worrisome to Broader Market?")

