The price action for U.S. December corn futures has been weak for some time now, likely due to the reality that supply continues to outweigh demand.
As the corn market digests this reality, the bulls hope is that the market has fully priced in this year’s crop. Let’s discuss and review the week ahead.
Weekly review and highlights for the week of November 13:
- Monday’s Weekly Crop Progress report showed the U.S. corn harvest improving to 70% complete as of November 5th, which compares to 84% a year ago and the 5-year average of 83%. Iowa managed to close the gap on its 5-year harvest pace with weather conditions proving to be much more accommodating for picking corn. Iowa’s corn harvest was reported at 67% complete versus 84% last year and 84% on average. However since October 22nd Iowa’s corn harvest has improved by 44%, which equates to nearly 6 million acres harvested over that 2-week time period. Meanwhile Minnesota also continued to make steady progress with its corn harvest improving to 60% versus 84% last year and 87% on average. That said, the feeling in Minnesota is that harvest could linger for another couple weeks with producers actively drying corn out of the field.
- On Thursday the USDA released its updated November 2017 WASDE report, which offered some surprisingly Bearish S&D revisions for the corn market to consider. The number generating the most post-report buzz was the USDA’s November 2017/18 U.S. corn yield forecast of 175.4 bpa, which was 3 bpa ABOVE the average trade guess and 3.6 bpa higher than the USDA’s October yield estimate of 171.8 bpa. The USDA’s yield figure also exceeded last crop year’s record final U.S. corn yield of 174.6 bpa. As a result of the yield increase, total U.S. corn production improved to 14.578 billion bushels, 298 million above the October projection of 14.280 billion bushels and 244 million bushels higher than the average trade guess of 14.334 billion bushels.
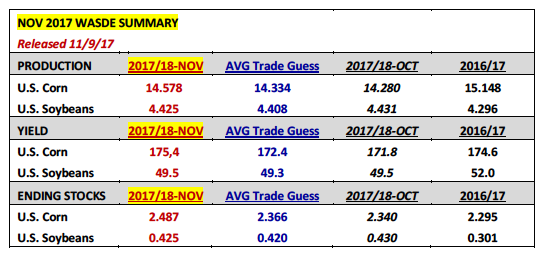
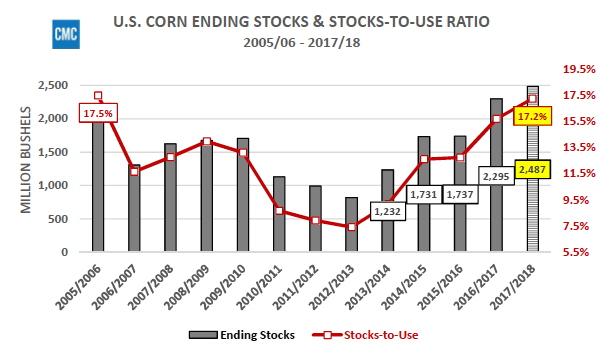
The USDA did its best to massage the supply increase relative to its net impact on U.S. corn ending stocks by increasing both Feed/Residual Use and Exports 75 million bushels each. That said the 2017/18 U.S. corn carryout still ballooned up to 2.487 billion bushels, +147 million bushels month-on-month and the largest U.S. corn ending stocks figure since 1987/88. The stocks-to-use ratio penciled back at 17.2% versus the 5-year average of 13.5%. This is currently the highest stocks-to-use ratio since 2005/06’s 17.5%.
2017/18 state corn yields continued to amaze, given the fact that this year’s U.S. corn crop did NOT enjoy a perfect growing season with challenges noted throughout the spring and summer in states such as South Dakota, Nebraska, Iowa, Illinois, and Indiana…all five states ranked in the top six of total state corn producers in the nation. And yet look at the state yields posted by NASS in the November 2017 Crop Production report…
- South Dakota’s yield was estimated at 150 bpa down just 11 bpa from its record yield in 2016 (161) despite its corn crop being rated just 30% good-to-excellent on July 16th, 2017.
- Nebraska’s yield was estimated at 179 bpa down just 6 bpa from its record yield in 2015 (185) despite enduring expanding drought-like conditions during the month of July.
- Iowa’s yield was estimated at 197 bpa down just 6 bpa from its record yield in 2016 (203) despite enduring similar expanding drought-like conditions during the month of July.
- Illinois’s yield was estimated at 198 bpa down just 2 bpa from its record yield in 2014 (200 bpa) despite a good-to-excellent rating this October of 63% versus its October rating from 2014 of 83%.
- And finally, Indiana’s yield was estimated at 181 bpa down just 7 bpa from its record yield in 2014 (188 bpa) despite a good-to-excellent rating this October of 59% versus its October rating from 2014 of 78%.
Point being on paper given the information the market had both subjectively via crop condition ratings and objectively from actual summer weather events…this wasn’t supposed to be the year where achieving a record U.S. corn yield was even remotely plausible. And yet here we stand in November staring at another huge U.S. corn crop (2nd largest ever) and not nearly enough demand to chew through growing U.S. corn ending stocks.

December Corn Futures (CZ7) Short-Term Price Outlook
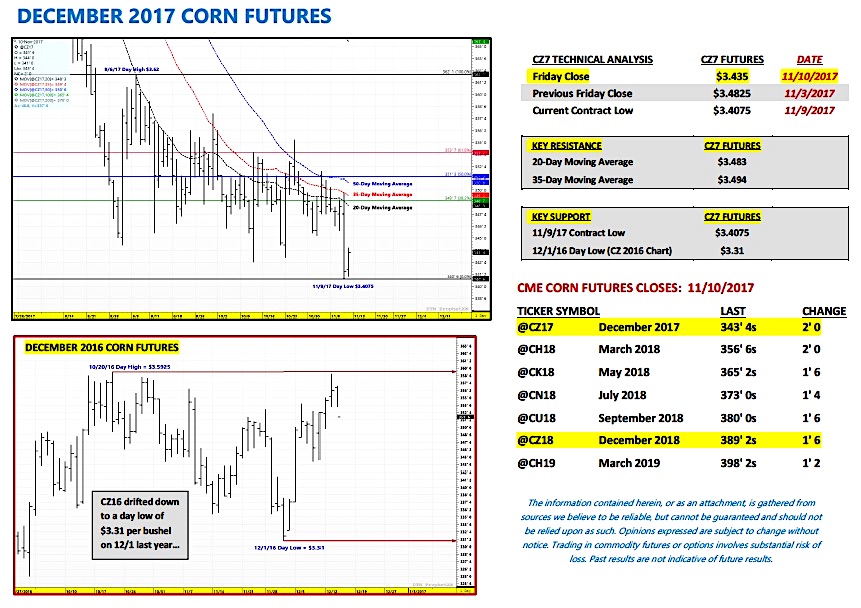
On Thursday (11/9) the corn market predictably sold off to new contract lows ($3.40 ¾), closing down 6 ¾-cents per bushel versus the December contract at $3.41 ½. Despite Money Managers already carrying a net corn short in excess of 200,000 contracts (current record Managed Money corn short = 229,176 from 3/8/16) the Bearish fallout from the November 2017 WASDE report was impossible to ignore.
The Supply and Demand (S&D) related obstacles to future corn rallies are several with private analysts already projecting even larger U.S. corn ending stocks for 2018/19 predicated on massive carryin stocks, slightly higher planted acreage, an initial trend-line yield forecast between 172-173 bpa, and stagnant U.S. demand. Collectively that S&D mix will be very hard to overcome for Corn Bulls hoping for 20 to 30-cent rallies both short and potentially longer-term.
Food for thought…last year in the November 2016 WASDE report the USDA increased the 2016/17 U.S. corn yield to 175.3 bpa and raised U.S. corn ending stocks to 2.403 billion bushels. This resulted in December 2016 corn futures drifting down to a day low of $3.31 on 12/1/16. Comparatively speaking this November the USDA estimated the 2017/18 U.S. corn yield at 175.4 bpa and U.S. corn ending stocks at 2.487 billion bushels. Friday afternoon December 2017 corn futures closed at $3.43 ½. This would seem to suggest that additional price pressure cannot be ruled out over the next two to three weeks…
Thanks for reading.
Twitter: @MarcusLudtke
Author hedges corn futures and may have a position at the time of publication. Any opinions expressed herein are solely those of the author, and do not in any way represent the views or opinions of any other person or entity.
Data References:
- USDA United States Department of Ag
- EIA Energy Information Association
- NASS National Agricultural Statistics Service

: Worrisome to Broader Market?")

