For some time we have talked about 2 specific extremes in the S&P 500: Market Volatility & Investor Sentiment.
But as a confluence of 3 key themes have transpired to reveal a more complex and dynamic risk environment so far in 2018 we are steadily seeing a reset of these stock market extremes.
The two charts below could have a massive impact on how the stock market correction and overarching market regime plays out from here.
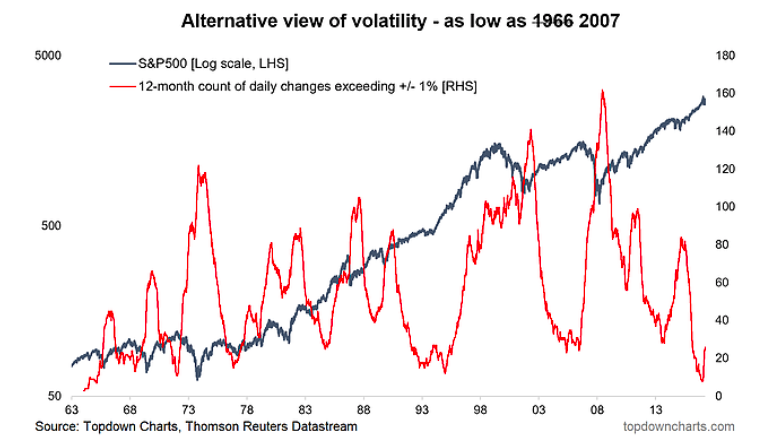
The first chart focuses on how extremely low volatility got before commencing the current reversion or revival that we are now witnessing. Yet it leaves an open question as to how the volatility revival plays out as we’ve seen instances where it happens during a major market topping process, as well as the transition to a more erratic bull market.
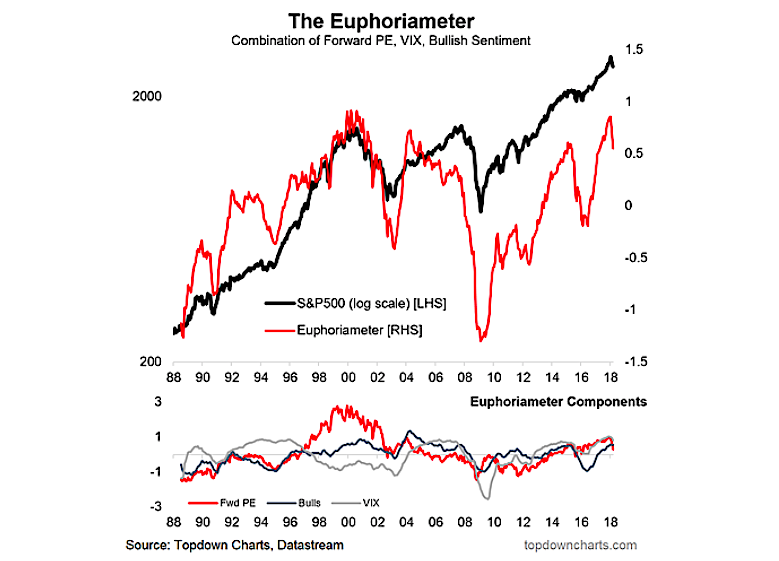
The second chart documents the reversal in sentiment from extreme euphoria – similar to levels seen at the height of the dot com bubble. Turning points in this indicator are far less forgiving than turns in the volatility indicator. However, to call again upon the late 1990’s there was the 1994 turn in this indicator which ended up being a mid-cycle reset.
With that I will leave you to debate these flask-half-full and flask-half-empty interpretations.
The key points on S&P 500 indicator extremes are:
- An alternative indicator of stockmarket volatility has turned up from extreme lows.
- The Euphoriameter has pulled back from extremes and has completely unwound the tax-cut hype.
- The trouble is both of these phenomenon have occurred during major market topping processes in the past with a couple of notable exceptions.
1. Extreme Low Volatility: One of our favorite charts – the alternative view of volatility for the S&P 500 (runs a rolling 12-month count of daily percent changes in the S&P 500 which exceeded +/- 1%). This indicator reached an extreme low of just 8 days (out of a total 252) where daily price change exceeded 1%… you had to go back to 1966 to find a similar low reading. But with the YTD action in 2018, the indicator has moved up to 26 as of Friday’s close. This now brings it to the levels last seen in 2007! In that case the turn up in volatility from extreme low levels was part of a topping process (as opposed to the turn up 1996 which marked the more erratic phase of that bull market).
2. Extreme High Euphoria: Another favorite, The Euphoriameter, has now fallen 0.3pts from the high in January (this is a composite z-score… so that’s a movement of 0.3 standard deviations). The January high came very close to recapturing the lofty heights of the dot-com euphoria. The correction has taken the Euphoriameter back to April-2017 levels, so the tax-cut hype has been completely and truly unwound. All this over what one might argue is simply noise (in terms of the headlines which have driven the reversal in sentiment).
Twitter: @Callum_Thomas
Any opinions expressed herein are solely those of the author, and do not in any way represent the views or opinions of any other person or entity.


