I received a lot of comments from people about my most recent GoPro (GPRO) post.
No kidding, people were vehemently angry that the chart pattern and math said it could decline further… folks, I’m not trying to make anyone angry by any means – it’s a blog and I enjoy sharing my thoughts as it 1) makes me think about future investments, 2) solidifies my thought process, 3) helps me maintain my skill and 4) pr0vides some education on a POTENTIAL way to manage risk in these markets. So, please don’t get bent out of shape because the “geometry” says GPRO can go to XXX or YYY.
TO ME IT’S ALL NUMBERS
I DO NOT CARE about a particular securities fundamentals, profitability or any of that… If you do, great. If you don’t, great.
A couple people recently approached me and asked me to blog about square roots, a key component to my “patterning”.
SQUARE ROOTS ARE THE KEY UNDERLYING STRUCTURE OF ALL PRICE and TIME ON A CHART OF ANYTHING
It’s theory is musical in the frequency of a string and the tension are components of the square roots of it’s length and 1/square root of tension… okay, I’ll stop there. You get the point, not going to go any farther than that.
The “ancients” believed that the numbers 1-5, their square roots and the inverse of those square roots were responsible for all of creation. Sounds cool and not going to debate if it’s true or not but somehow they knew how to PRECISELY calculate every eclipse, planetary synodic period and, oh by the way, the exact end of the great year (26,000 years ish) and some other cool stuff.
So, if Pythagoras (smart dude) discovered the power of ratio’s and musical theory AND the slight possibility that the market is vibrations and musical, then there must be a square root component in there.
Square Roots? Enter Twitter (TWTR)
So in order to reinforce my belief that there is a natural vibration and harmony to the market I chose a random stock – Twitter (TWTR) to check it out. (I was just on my Twitter feed so that’s why… )
I truly had no idea where this was going to take me – those of you who know me realize that I really didn’t and then some of you will think I planned it. Folks, I didn’t. I erased everything on my Twitter stock chart (TWTR) and just pulled out a calculator.
So, take a ride on the Twitter stock train and note the PRICE component of the square roots starting with the low of 39. There is also a timing component of the square root – but we’ll do that sometime in the future.
The Gann Square of 9 is based on square roots… one full trip around the circle is the (square root of XXX+/-2)^2. If you want to go 2 trips around then it’s +/- 4… note the all time low on Twitter – it was a 2 trip turn around the wheel from 75 AND a 1.272 extension (1.272 is the square root of 1.618). When that happens (overlapping square root target and pattern levels overlap) it’s a good probability that ‘stuff’ is going to happen. click chart to enlarge
Twitter Stock Chart (TWTR)
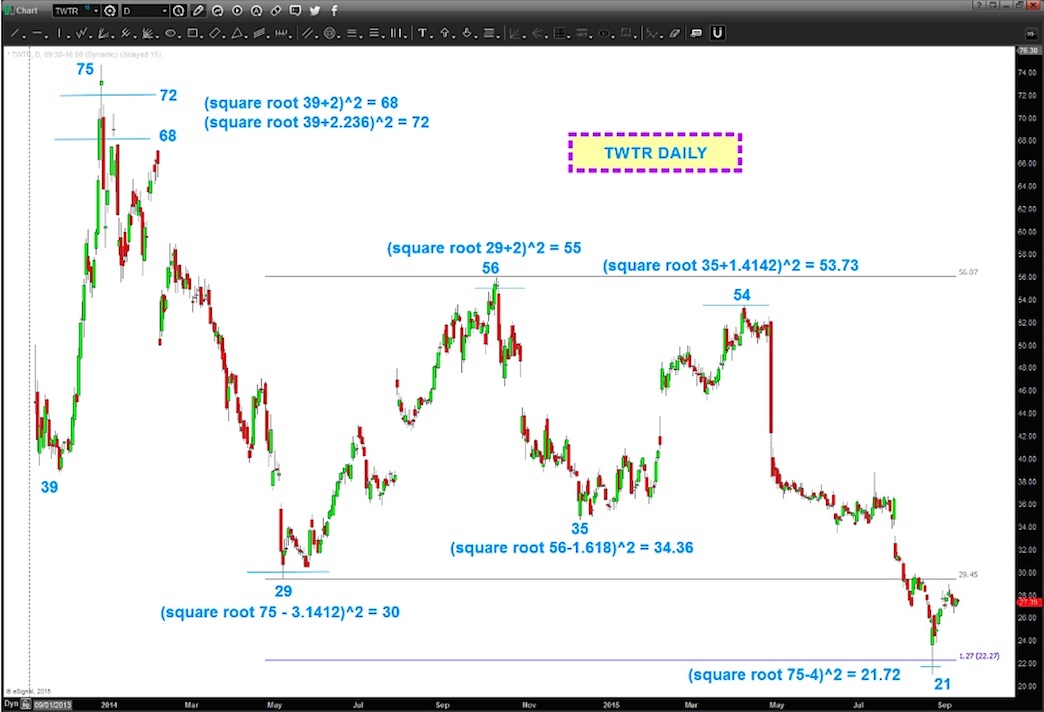
Also note, just like we do “typical” projections from price we can do the same thing with the square root targets. We used Pi, the golden mean, and the square roots of 2 and 5 to project POTENTIAL inflection points.
ALL OF THEM HIT. So, one has to ask: “self, does the entire trading Twitter universe know about the square roots or is something else happening?”
You do the math (that was a joke) and decide for yourself.
No matter what your trading/investing style is HOPEFULLY this will show you how powerful square roots can be to manage risk.
Thanks for reading.
Twitter: @BartsCharts
Author does not have a position in mentioned securities at the time of publication. Any opinions expressed herein are solely those of the author, and do not in any way represent the views or opinions of any other person or entity.

: Cup (and Maybe Handle) Watch")
 Trading Near Top Of Price Range")

