The past two years have seen the treasury bond market turn upside down. In short (pun intended), treasury bonds have been hit hard by selling.
Note that we highlighted an important test of resistance for treasury bond yields last week.
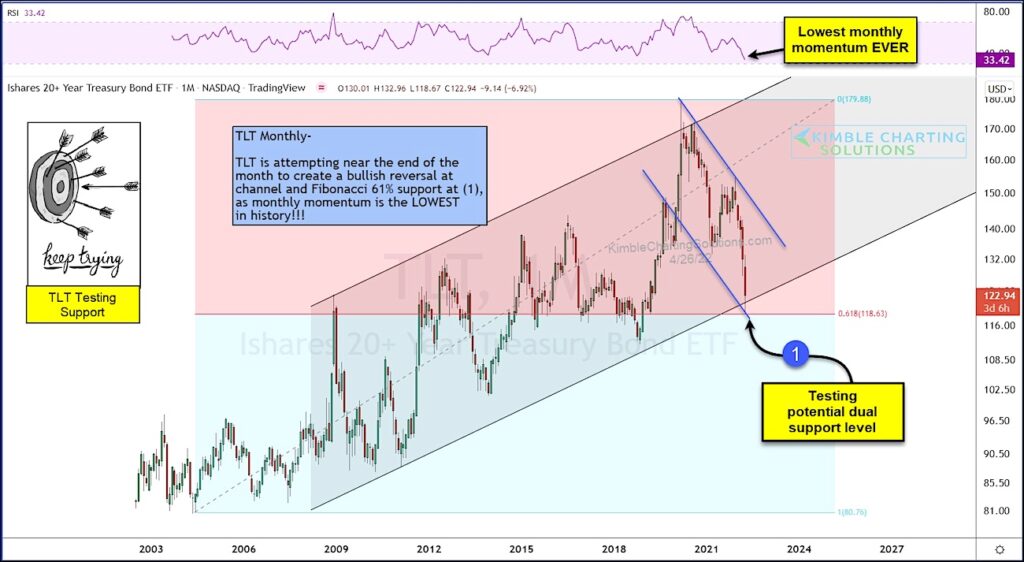
Today, we look at a long-term “monthly” chart of $TLT, the 20+ year treasury bond ETF.
As you can see, treasury bonds are in a 2-year down trend (market by blue lines). And $TLT is currently testing the lower channel support line heading into month-end. And, at the same time, it is testing its 61.8% Fibonacci retracement support level!
Equally important is that $TLT is recording its lowest “monthly” momentum EVER!
Will it finally succeed in finding some support? Well, if it can’t bounce here then look out! Stay tuned!!
$TLT 20+ Year Treasury Bond ETF “monthly” Chart
Note that KimbleCharting is offering a 2 week Free trial to See It Market readers. Just send me an email to services@kimblechartingsolutions.com for details to get set up.
Twitter: @KimbleCharting
Any opinions expressed herein are solely those of the author, and do not in any way represent the views or opinions of any other person or entity.
: Creating Bullish Divergence?")


 and Semiconductors (SMH): Concerning Price Pattern?")


