It’s been a crazy past couple of years for the 10-year US treasury bond yields and interest rates.
The crazy extremes have seen rates fall to near zero and his back up near 3 percent.
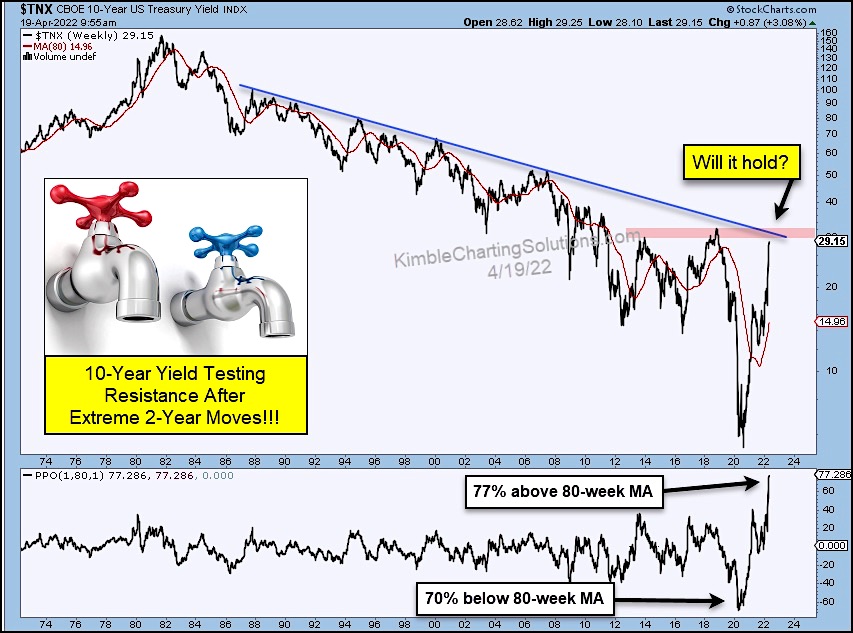
We can see this in today’s long-term chart of the 10-Year US treasury bond yield.
As you can see in the lower panel, interest rates went from 70% below 80-week moving average to the current 77% above the 80-week moving average. Talk about extremes!!
The recent extreme move higher has interest rates testing long-term trend line resistance.
Will it hold? It better, or interest rates may spike even higher! Stay tuned!
10-Year US Treasury Bond Yield Historical Chart
Note that KimbleCharting is offering a 2 week Free trial to See It Market readers. Just send me an email to services@kimblechartingsolutions.com for details to get set up.
Twitter: @KimbleCharting
Any opinions expressed herein are solely those of the author, and do not in any way represent the views or opinions of any other person or entity.

: Worrisome to Broader Market?")
