To say the bond market is suffering right now would be an understatement. We are seeing just about record everything. And depending on your timeframe, we’re also seeing near record drawdowns on treasury bonds.
Let’s review some facts and figures in the world of treasury bonds.
November was the worst month for bonds since 2003. Several weeks ago we saw the worst week ever for the iShares 20+ Year Treasury ETF (NASDAQ:TLT). You can read that post here.
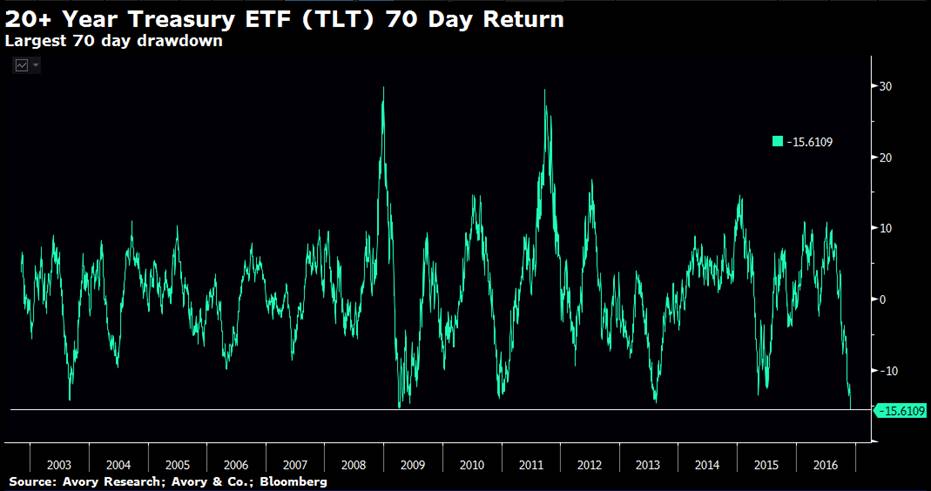
And now we are seeing the worst 70 day period on record for the treasury bond ETF (TLT). That’s right, treasury bonds near record drawdown levels. See the chart below.
Over the last 70 days, the Treasury bond ETF is down -15.6%. BUT the reality is however, this is not a rare occurrence. Since inception of the ETF here are some average occurrences.
- 5% drawdowns: Twice a year on average
- 10% drawdowns: Once a year on average
- 14% drawdowns: Once every 2 years.
So while the bond market is being hit hard, this type of move happens once every two years. Not so extraordinary, when put in historical perspective.
You can catch more of my market insights on my site, The Market Meter. Thanks for reading.
Twitter: @_SeanDavid
Any opinions expressed herein are solely those of the author, and do not in any way represent the views or opinions of any other person or entity.


