 By Alex Salomon
Last week was the first installment of my new weekly trading column, “Trading Ideas.” Similar to my scribes in “Investment Lessons for Life,” I would like to make this column into a real-life investing column rather than a once a week post throwing stock names in a hat to pull out and buy. For this reason, I will try to review my previous columns and ideas and keep readers posted like a rolling journal. Also, if you follow me on twitter @Alex__Salomon, you can read about most of my investments and pick up a better feel for how often I trade… and you can feel free to send me suggestions and ideas!
The first lesson for this week is worth repeating: some weeks, I will punt. As I am not a professional trader, I understand that there is no need to trade everyday, or even every week for that matter. For this reason, my ideas will solely depend upon the indicators I use and current market environment for investing.
As Andy Nyquist just wrote in his Chartology of the S&P 500: “A weather report for the markets would probably read partly sunny with a chance of hail. In short, it has been one choppy ride.” I agree, it’s been rough! Which is all the more reason to employ technical indicators and strict risk management measures.
So let’s have a look!
Based on the indicators I follow, the market remains very tenuously bullish. The S&P 500 had to stay above 1330 and it did, currently sitting with a 2.4% cushion. Even more importantly, the Powershares QQQ’s (QQQ) had to stay above the 150-day Moving Average (MA) to prevent a crack down, and it did. As well, the QQQ’s spent some time above $65, and despite Friday’s weak closing at $64.24, I believe we’re still okay. Note that the 150-day MA for the QQQ’s is now $63.30 and that defines my “danger red alert zone.” Let’s review my QQQ position and risk management from last week: “entry around $63, first profits at $64.30 [check] OR add at $64.30 (with a stop at $63.00), then take profits at $65.50, raising your trailing stop to $64.30, take more profits at $67.50 and use $1.00 or $1.50 as your trailing stop should we burst higher.”
Before we come come back to QQQ for the week (hint: it hinges on a certain fruit reporting results this week), let’s quickly review the rest of the trade ideas:
3D Systems Corp (DDD): Unfortunately, I missed out on this one. Had I gotten in, I would have hypothetically taken partial profits at $35.25 (7% gain) and run the rest of the position with a trailing stop at $34.00 with next profits at $37.50.
I wasn’t quite as thorough with Intel (INTC) or the ishares Semiconductors Index (SOXX), but I did write “Lastly, I am bound to consider SOXX again, as it is revisiting the support from the previous break out and a repeat could yield $50 to $52.” And since it did hit $50 on Thursday and thus, I would have taken profits on 1/3 of the position (4% gain), while keeping 2/3 with a target of $52 and a stop at my entry price. Note that I DID take a position in the 3X Semiconductors (SOXL) on Monday at 21.70 and took half off on Wednesday (+10%), with a trailing stop on the remainder at entry price.
The Sherwin-Williams Company (SHW): Before I follow up on this one, note that I am writing a quick, quirky, honest and blunt column about SHW. Note as well that I did NOT take a position in SHW, so this is purely a review with hypotheticals: “On a tight short-term scale and tight risk profile, I will use 07/12 $127 as my risk…” so assuming entry at $128, I would have lost $1. “On a longer term risk profile, I would use June 1 “remember the gloom and doom” of $124 as my risk and thus book profits at $136, $142 and trail the rest as long as possible — using a longer trail (for instance, if the stock hit $142, I would use a $130 trail).”
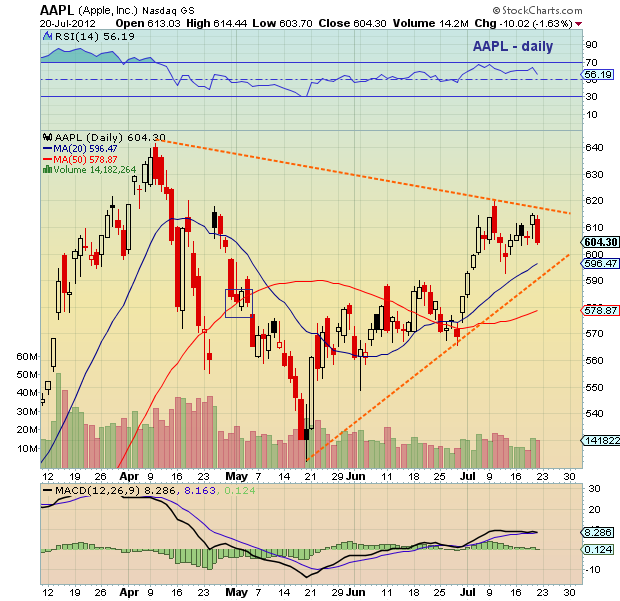
Looking at the week ahead, Apple (AAPL) is my go-to stock (also see: Apple Technical Update by Andy Nyquist). On the one hand, there is a downtrend line just overhead (formed by drawing a line from the April top down to the recent $620 and extended); on the other hand, you have an ascending uptrend line underneath (formed by drawing a line through recent lows). This technical formation is called a wedge, formed by the upper and lower trend lines. If Apple clears the upper wedge line ($621.50 is my first target), it should revisit $640.
So one could buy Apple on Monday (ideally, right between $599 and $605) and hold into earnings, looking to shed 1/3 at $621.50, while keeping the rest for a test of the all-time highs (and higher). Note that I currently have a position in Apple, and should earnings disappoint, I will bluntly cut the position, take the loss and move on… until next time.
To be clear: trading Apple this week is extremely binary and missed earnings will penalize the stock by 10% or more, making it a very risky trade and should be planned accordingly.
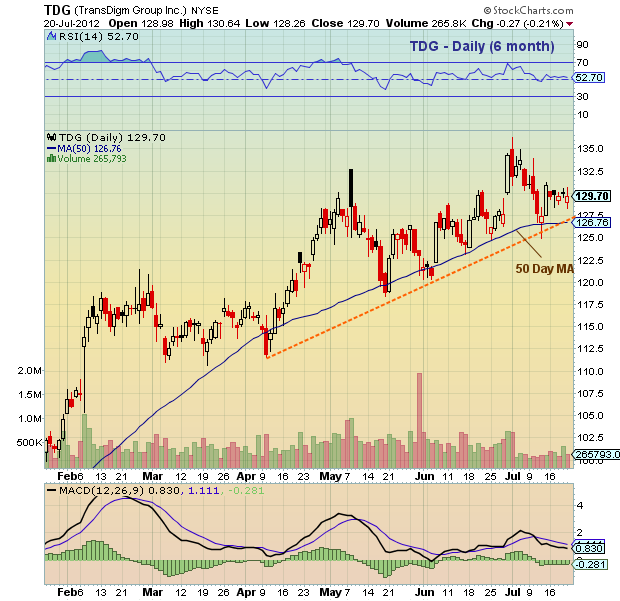
For other ideas, I am looking at TransDigm Group Incorporated (TDG) as a long opportunity. It is currently resting on its 30-day moving average and has consolidated beautifully around $130 for the entire month. As well, its 50 day moving average has provided unbreakable support since November 2011. For me, I am eyeing this as a possible longer term hold position, defined by a $4 trailing stop (let’s say $1.00 below the 50 day moving average). Once in, I would take profits at $135 (OR possibly add to the position and raise my stop to previous entry). The next level to eye for profits would be $140, trailing the remainder for as long as possible. I’ll update next week should I engage in a position in TDG.
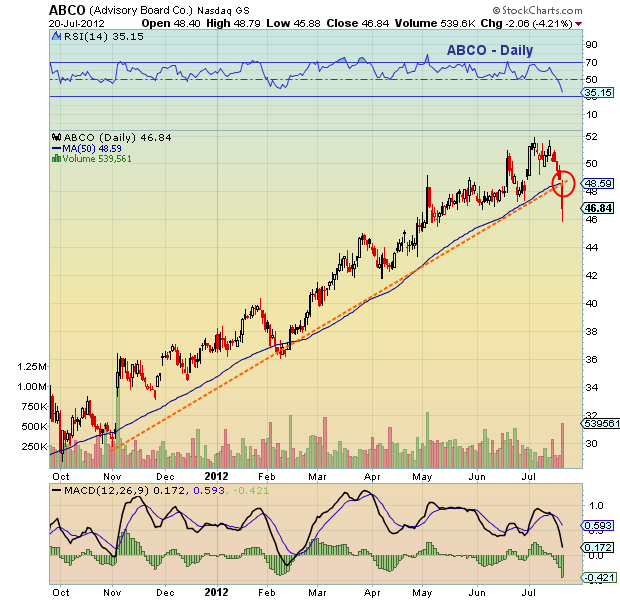
I would also like to point out a possible short idea: Advisory Board Co. (ABCO). I started a short position in this stock on Friday July 20 on a nasty break of an extremely well-defined trend line.
For ABCO, shorting around $47 looks good to me, using $49.50 as a covering price (risk is $2.50), shedding 1/3 at $45 and the rest at $42.50.
Lastly, on a macro level, I am starting to eye a bullish EURUSD position (Euro gaining vs. Dollar falling) and may soon consider shorting UUP and EUO… Not yet, but on my radar.
Disclosure: At the time of writing, I own AAPL common stocks, puts, calls and plan on adding within 72 hours. I also own TQQQ (3x ETF based on QQQ). 3x ETFs are riskier vehicles and investors considering them should carefully read the risk disclosures written by each leveraged ETF underwriter. I also own SOXL (3x ETF based on SOX). I am also short ABCO (from $48.50, targeting $42) and could add to my short in the next 72 hours. I might buy long common stock in TDG in the next 72 hours.
—————————————————————-
Twitter: @alex__salomon @seeitmarket Facebook: See It Market
Any opinions expressed herein are solely those of the author and do not in any way represent the views or opinions of his employer or any other person or entity.


