It is an understatement to say that trading in Treasury bonds was volatile – just check out the action on various yields last week.
From intra-day low to high, the 10-year yield swung 20 basis points, but closed out the week essentially unchanged – trading down one basis point, to 2.14 percent. The 30-year had a range of 19 basis points, but rose two basis points, to 2.92 percent.
Bonds rallied strongly off the lows. At Wednesday’s lows, iShares 20+ Year Treasury Bond (TLT) was down 3.2 percent for the week, before reversing to end the week down 0.8 percent – in the process creating a hammer on a weekly chart. More on that later.
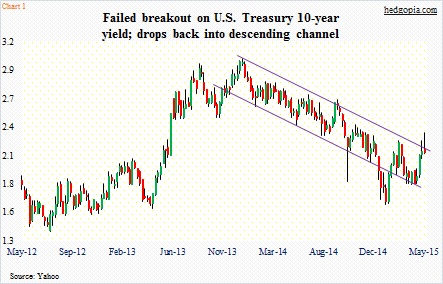
First let’s look at a chart of the 10-Year Treasury Yield (TNX).
Why the reversal, you wonder? It is not easy to pinpoint an exact cause-and-effect. But several things could be at play.
Of late, German bunds have come under tremendous selling pressure, so that could have influenced trader sentiment. Secondly, we have heard of how there is less liquidity in the bond market, which can intensify movement in yields. Last but not the least, yields have been rising for nearly a month now. The 10-year yielded 1.85 percent on April 17; at Tuesday’s highs, it was yielding 2.34 percent. That is a nearly 50 basis-point move in a month!
Now let’s turn to the 30-Year Treasury Yield (TYX).
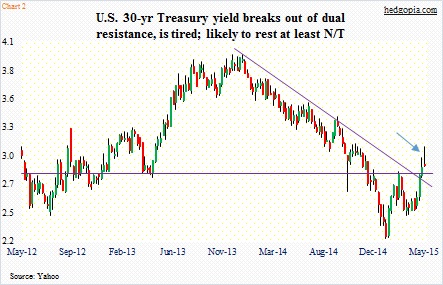
In the middle of last week, the 10-year yield broke out of its December 2013 downward sloping trendline, but could not hang on to it (Chart 1). The 30-year remains above resistance (Chart 2), but barely.
Here is the irony.
Despite all the technical factors that led to the rout in bonds in recent weeks, U.S. data continue to come in weaker than expected. From retail sales to industrial production to consumer sentiment, they were all soft last week. The weekly unemployment claims were a saving grace, but it is possible this series is at an inflection point.
This is probably setting up for a trade on the 20+ Year Treasury Bond ETF (TLT) – which closed at 121.59. Perhaps we could use a cash secured put.
As of Friday’s close, May 22nd weekly 120 puts were selling for $0.44. If put, it is an effective long at 119.56. The idea here is to generate income in order to enhance cash flow but at the same time be ready to own if put. Perhaps better prices will emerge. Risk-reward is favorable. Price action will change things but the concept is there.
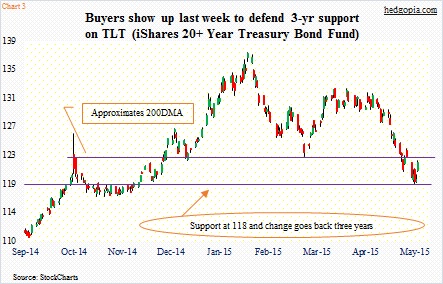
Last week’s low was 118.64. Support at 118 (give or take) goes back three years. The hammer last week is a signal that bulls are ready to defend that support – at least in the near trading future. Who knows where interest rates are headed in the intermediate- to long-term! Hence, the trading ideas with the weekly options.
Shorts have been reducing their bets on TLT. As of end-April, short interest stood at 13.7 million, up a million from a month ago but down substantially from 24 million at the end of November.
The risk of getting put comes from the following.
FOMC minutes for the March meeting are due on Wednesday, and will probably reiterate their desire to hike rates later this year. A couple of things to consider: One, data have continued to come in weaker than expected since that meeting. And two, fed funds futures are no longer pricing in a rate hike this year.
Of the several data points scheduled to be released this week, three are housing-related – the NAHB/Wells Fargo Housing Market Index, housing starts, and existing home sales. The CPI is on Friday. Recent inflation readings – ranging from the CPI to import prices to average hourly earnings to the PPI – have been on the soft side. If they come in stronger than expected, the 118 support can once again come into play. With that said, daily indicators are grossly overbought, and are turning up.
Thanks for reading.
Follow Paban On Twitter: @Hedgopia
No position in any of the mentioned securities at the time of publication. Any opinions expressed herein are solely those of the author, and do not in any way represent the views or opinions of any other person or entity.


 Pressuring Lower Price Support")


 Pressuring Lower Price Support")